
OSINT Field Notes #1
DIY Power Grid Map, a hole in the Great Wall, tracking fishing vessels and the most detailed birds eye view you've ever seen.
Welcome to the very first edition of OSINT Field Notes.
Over the past month, I’ve often been reminded that the most crucial evidence often hides in plain sight. Whether it’s the unseen geometry of a shadow to solve a geolocation puzzle or the precise weave of a shawl identifying a militia group, the clues are always there if you use the right lens.
This issue is all about chaining technical tools together to find those clues. In the content below, you’ll find:
Dispatches - innovations and resources.
From the Toolkit - detailed ‘birds eye’ imagery.
Technical Teardown - how to make a power grid map.
Case File - The Chinese company selling mass censorship & surveillance.
Thanks for joining me in this, Ben.
1. Dispatches
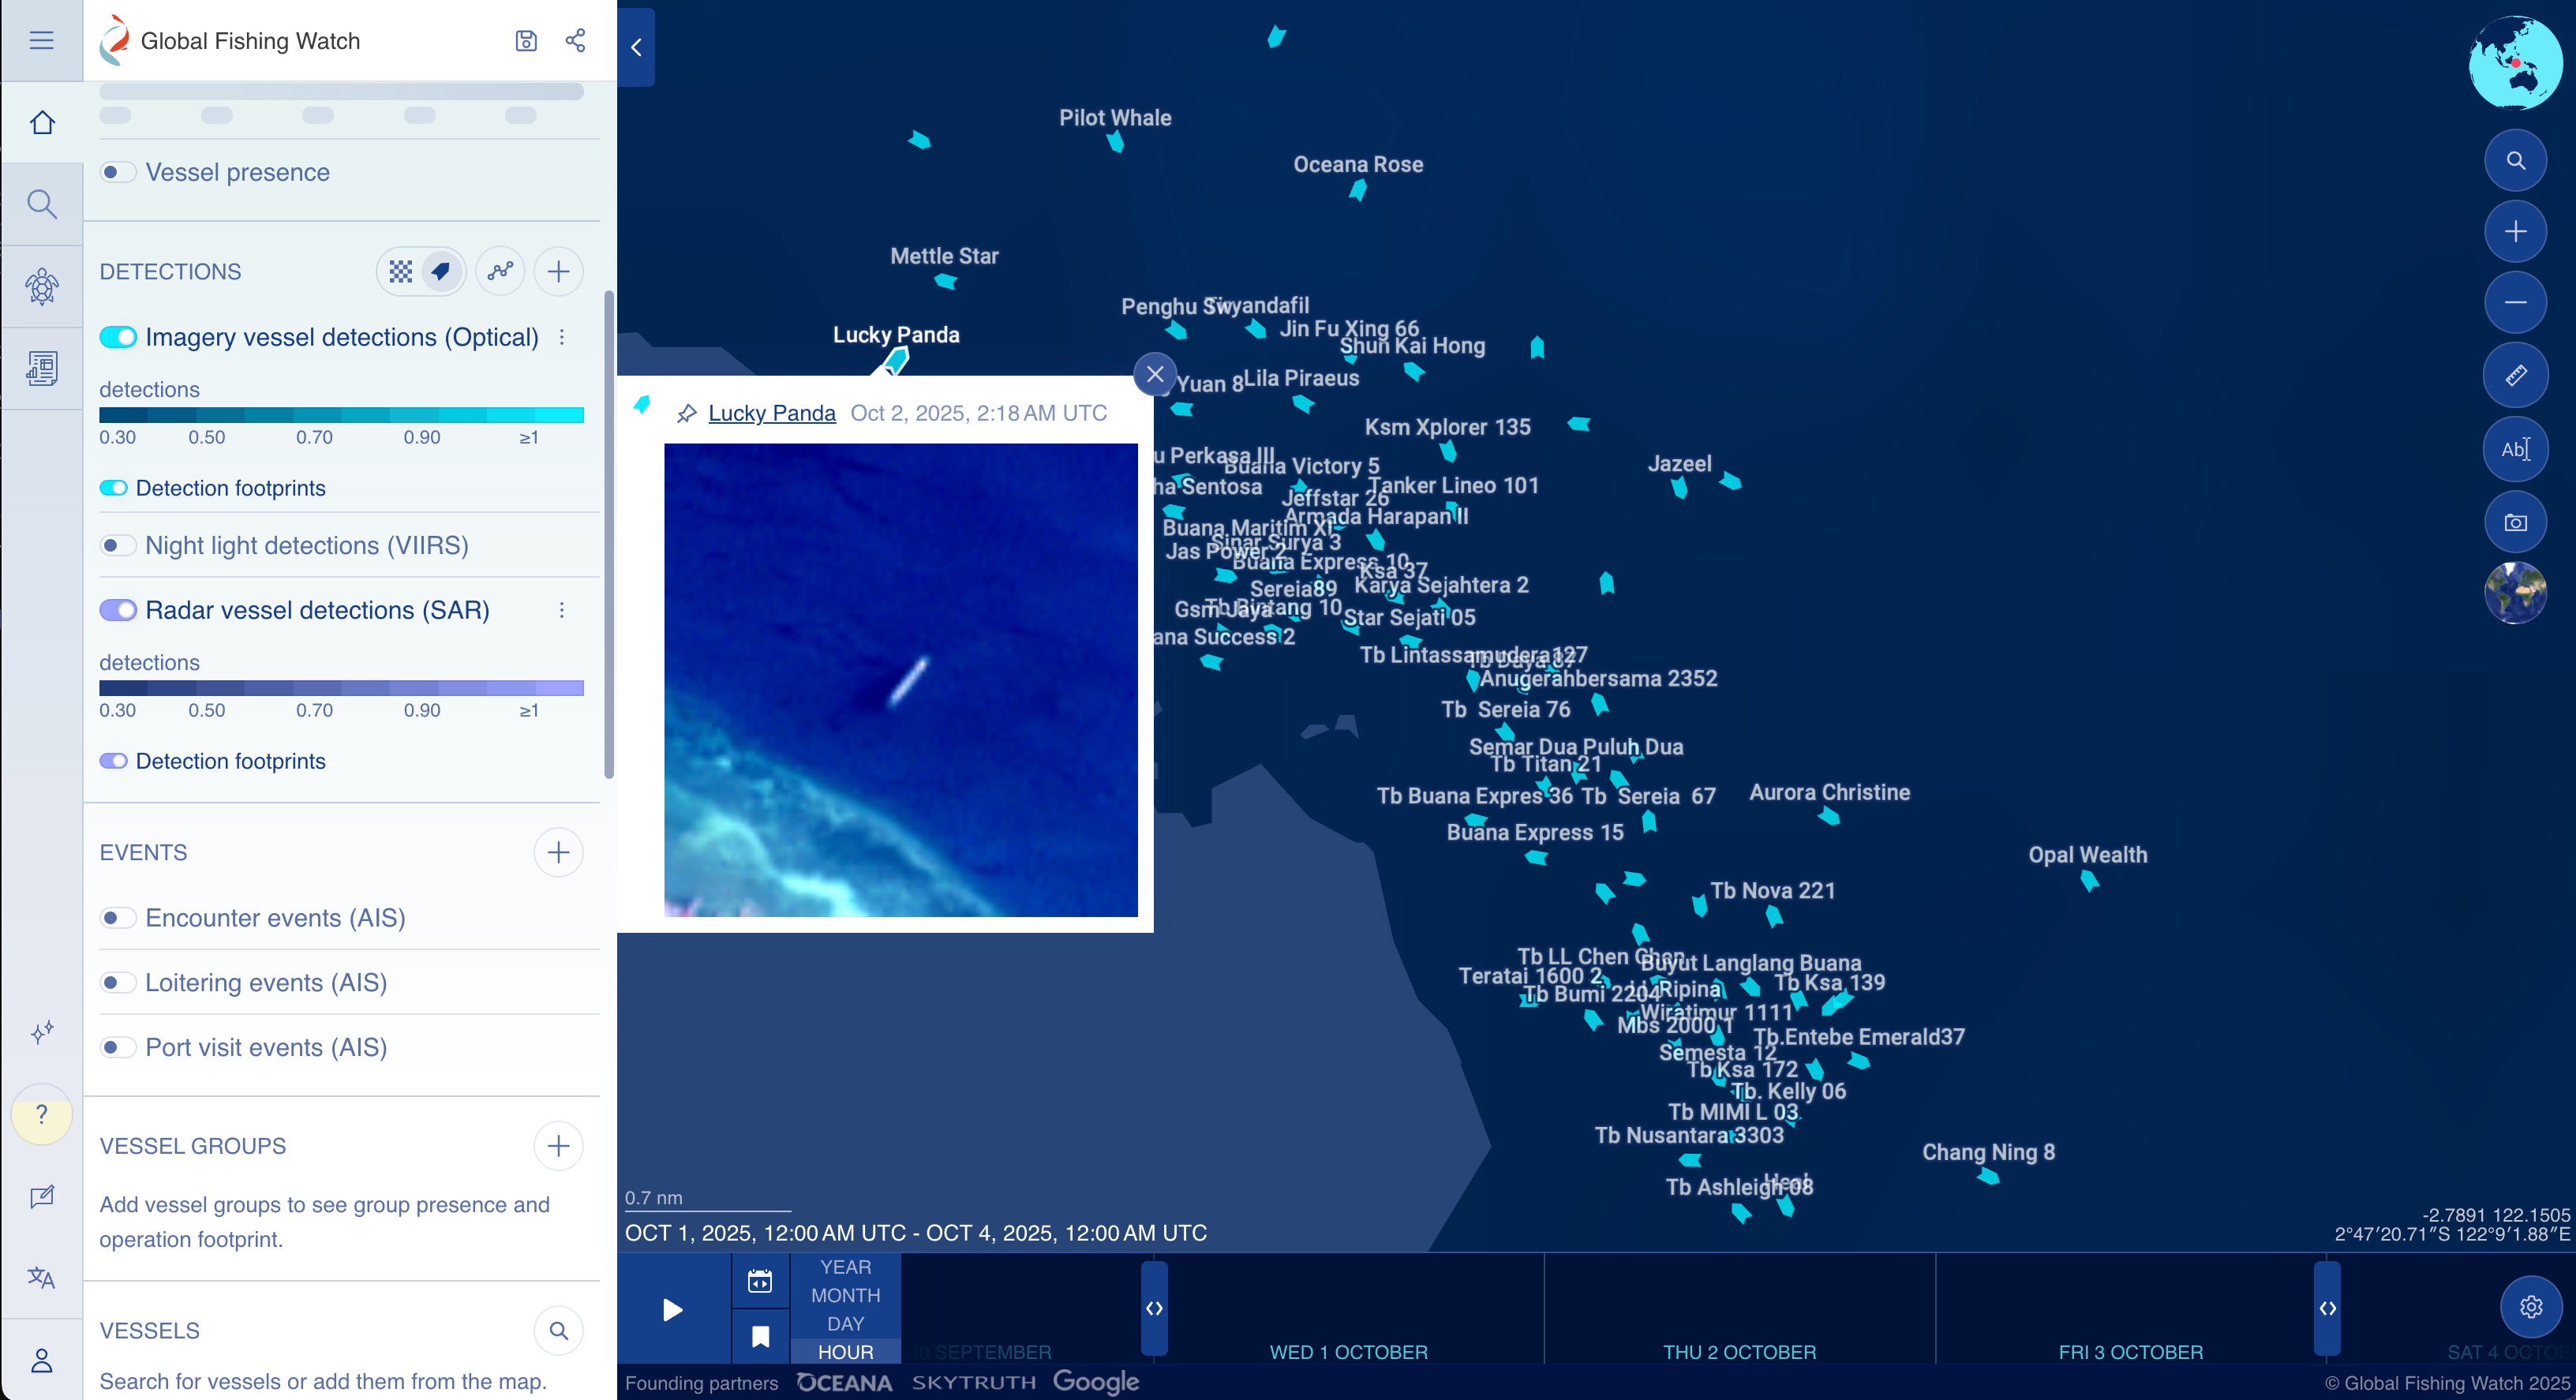
Global Fishing Watch Map - Global Fishing Watch announced expanded detections by fusing Planet imagery in its pipeline, complementing the Sentinel-2 layer to spot small, non-AIS vessels in coastal areas, mitigating a blind spot in near-shore fisheries monitoring. The takeaway for analysts is the GFW Map, with developments like this, expands the ability to monitor updated global vessel activity. With an additional bit of good old open source investigative research, the map can be a launchpad for further environmental, industrial and commercial investigations.
Meta Policy & Conflict Information Imbalance - Meta refreshed its Oversight Board recommendation tracker, listing case-by-case policy recommendations on key cases involving platform policy decisions. The tracker is a resource to understand how decisions are made on the platform and the type of content it impacts, especially in relation moderation that affects content visibility (e.g., extremist content, political speech). In one specific case study from Syria, the board highlighted how Meta policies can cause “information imbalances” in conflict by disproportionately restricting content.
Public Sentinel-2 imagery spots U.S. naval group in Caribbean - Publicly available Sentinel satellite imagery was recently used to successfully track and identify a US Naval group in the Caribbean. It’s a reminder for hobbyists and analysts of the power of freely available imagery for strategic awareness and monitoring of global events, pixel by pixel.
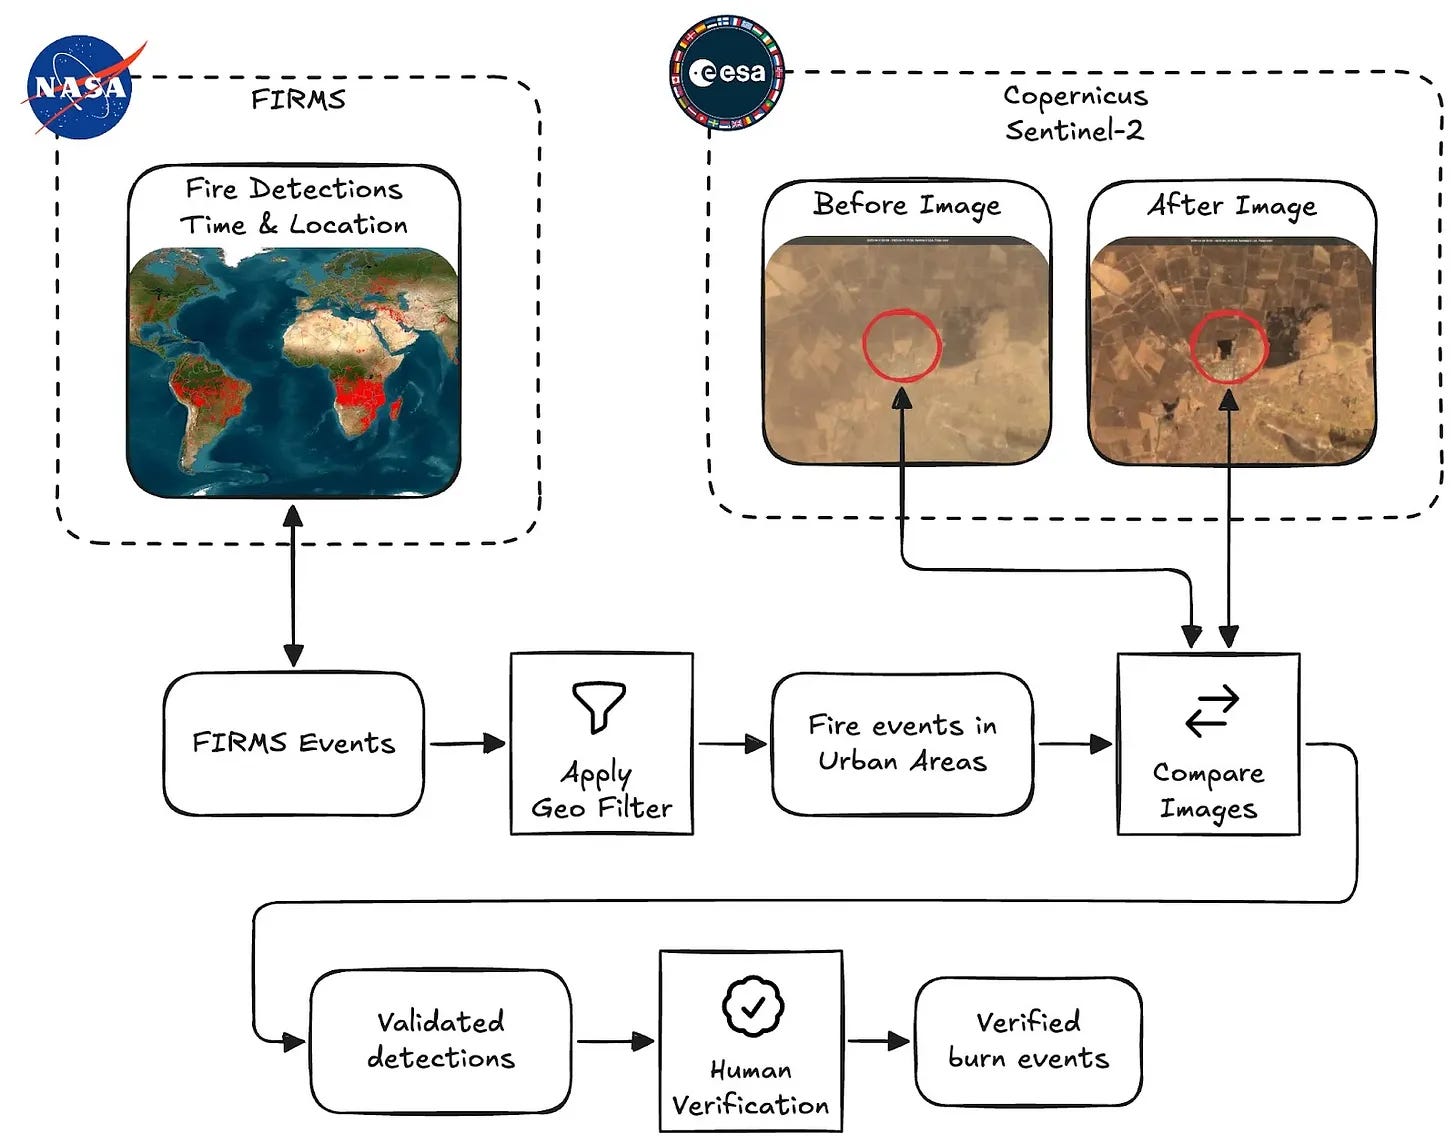
Automated Burn Scar Detection via Satellite Data - CIR and BigData Republic launched an open-source pipeline that automates the detection of suspected war crimes from space fusing NASA FIRMS and Sentinel-2 data to flag new burn events in and near settlements. The script changes the timely process of manually checking FIRMS and imagery, and allows investigators to refocus time on identifying footage from the ground that may have indicated who was responsible for a potential incident, rather than focussing on where and when it happened. The Burnscar Github repo can be found here.
Textile tells: Bellingcat links Saipikhup shawls to group ID - A recent Bellingcat guide on Manipur used a creative visual analysis by identifying traditional Saipikhup weaves (shawls) on uniforms to confirm group affiliation, a key reminder that every pixel leaves a clue, especially when it comes to things such as actor attribution - often the hardest part of visual investigations.
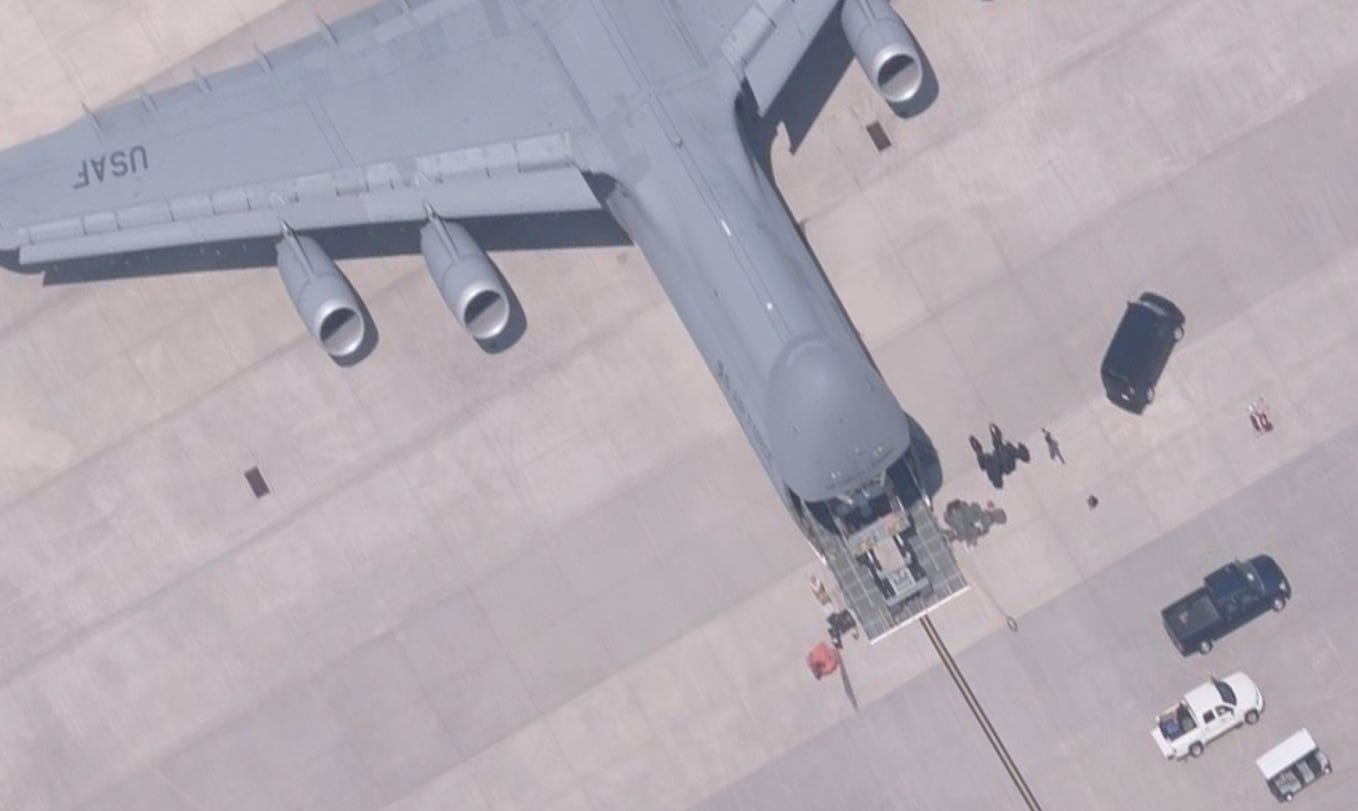
2. From the Toolkit
This month’s quick tool is Bing Maps’ often-overlooked Bird’s Eye View feature, which provides high-resolution, angled aerial imagery. While this angled close-up view is only available in select locations, it is a useful link to keep in your toolkit just in case the coverage is available. Here is a bit more on the Birds Eye View. In the comments, I’ve mentioned how to identify the date of these images, which is found by diving into the source code (for those that need it).
3. Technical Teardown: DIY Power Grid Map
In this Technical Teardown, we are going to walkthrough how to create your own map of energy infrastructure, focussing on transmission towers, power lines and energy facilities. Doing so is helpful for energy-based landmarks, grid mapping and more, all with a tool that can be made in the space of a few minutes. By the end of this, you’ll have a KML you can load into any mapping platform or satellite browser like Google Earth.
Step 1
Head to a chatbot (like Gemini or ChatGPT) and ask for an Overpass Turbo query to find all power grid infrastructure. This saves time on manual coding in Overpass Turbo and ensures coverage of all of the terms used by Open Street Maps (OSM) - where the data originates from.
You can try the following prompt:
“Make a query for overpass turbo to identify all power lines, poles, transmission towers, power facilities and anything else related to power infrastructure”For those that would prefer not to use a generative platform, here’s the output query:
/*
Comprehensive OSM power infrastructure (lines, cables, supports, substations, plants, devices)
– includes common missing features & better street-cabinet tagging.
*/
[out:json][timeout:90];

(
  // Core grid + facilities (nodes/ways/relations)
  nwr[power~”^(line|cable|minor_line|tower|pole|substation|transformer|generator|plant|busbar|converter|switch|switchgear|terminal|compensator|reactor|transition)$”]({{bbox}});

  // Power street cabinets (common tagging pattern)
  node[man_made=street_cabinet][street_cabinet=power]({{bbox}});

  // Indoor/underground facilities captured as buildings with power tags
  way[building][power~”^(substation|transformer|plant)$”]({{bbox}});
);

// Get all referenced nodes for ways/relations
(._;>;);

// Keep tags + geometry for analysis
out tags geom;
Step 2
Open Overpass Turbo. Paste the generated code. Hit Run over your specific area of interest. This gives you the OSM you requested.
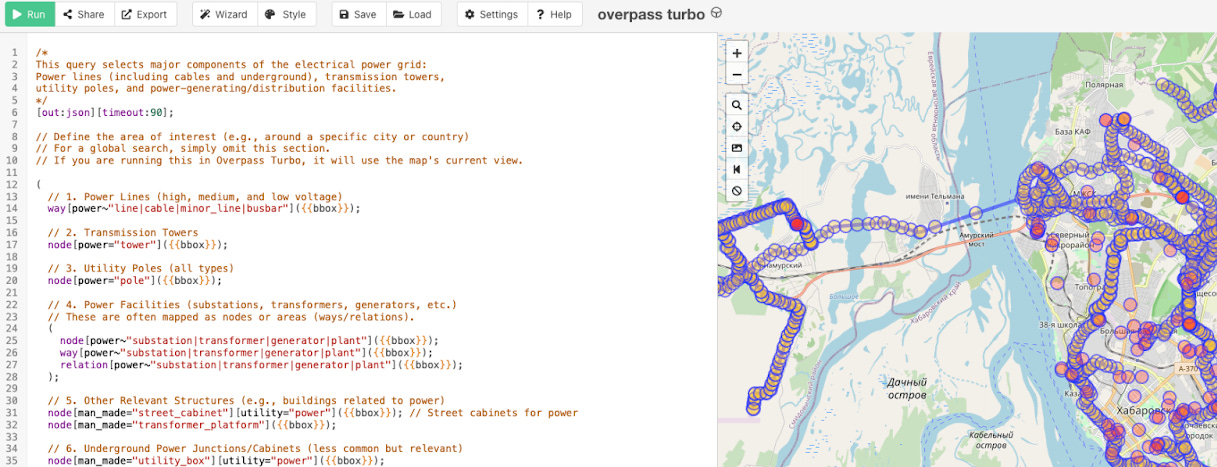
Step 3
Use the Export function to download the data as a KML file.
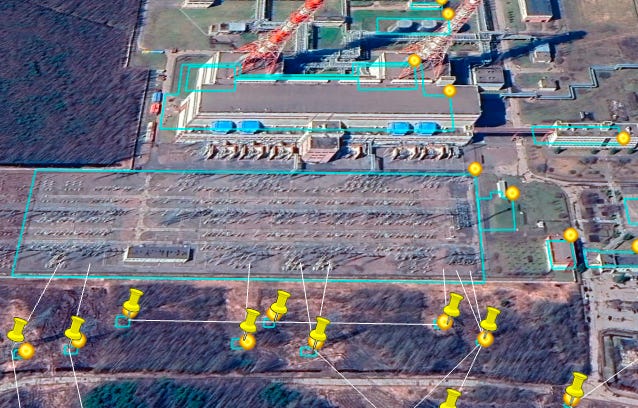
Step 4
Import the KML into your preferred mapping tool. I’ve used Google Earth. You now have a custom, shareable layer showing the exported mapped energy grid data from OSM. This is now layered onto the satellite imagery in Google Earth.

Now you have a shareable and collaborative map that acts as a tool for power-related infrastructure. It can be useful for supporting geolocations within that area if you have power-related landmarks, security research on events near power sites and more.
An alternative global version of a power grid map exists called the Open Infrastructure Map. I made a YouTube tutorial that covers its use. The benefit to building your own map is that you can be more exhaustive in what you want, and don’t want, as data points on your map.
Further analysis can be derived with the addition of other datasets, such as combining your new data layer with the online project WikiMapia and use the two, in tandem, with satellite imagery to analyse areas. You can find a WikiMapia KML with this search.
4. Case File: A Hole in The Great Wall
This Case File looks at analysis of the leak from China’s Geedge Networks, which changes what was once a black box of surveillance-for-hire into an open book for researchers.
Geedge Networks is a Chinese company that styles itself as a network-monitoring provider, but it produces a commercial version of China’s Great Firewall and products used to monitor large networks, such as telecommunications providers. These products allow users to monitor online information, block certain websites and VPN tools, and spy on specific individuals.
More than 100,000 documents were analysed from the leak, utilising an infrastructure with OpenSearch and DataShare. This was only part of the giant leak, and findings revealed that Geedge Networks provided infrastructure, software, and training to governments in Kazakhstan, Ethiopia, Pakistan, and Myanmar to establish systems of internet censorship and mass surveillance.
Considering the high levels of censorship carried out by the military junta in Myanmar and the use of technology to persecute civilians, and limit internet access, the technology outlines a playbook to switch off the internet to mask human rights abuses and target those who dissent.
The files also detailed similar surveillance systems deployed in China’s Xinjiang region in ongoing oppression against Uyghurs and minorities.
The leak also gives a behind-the-scenes view of one of Geedge Network’s products called Cyber Narrator. An excerpt from Interseclab’s September 2025 report shows the Cyber Narrator platform monitoring groups of individuals in specific areas.
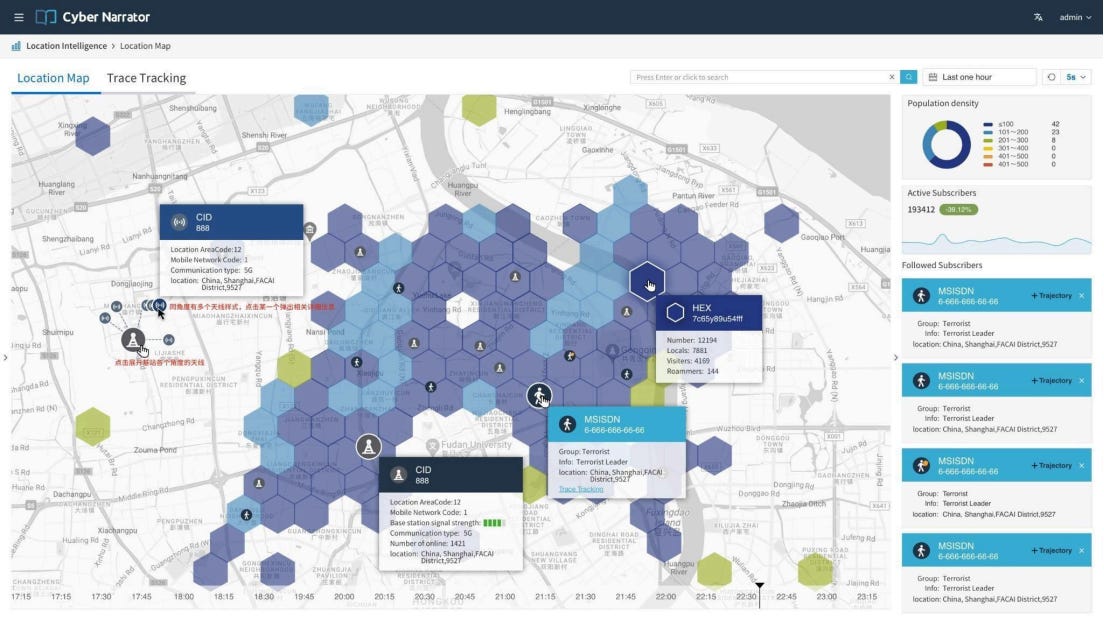
The data leak, as a source, is important because it exposes not just what the technology does, but who is involved and how these systems function. By knowing this, researchers have been able to report on at least three critical areas:
Proof of how Geedge’s business in Myanmar, working with local telecommunications companies, implemented surveillance and censorship technology on behalf of the military junta.
The specific use of this technology in China’s Xinjiang region, which is under intense internet controls as part of the state’s targeting of Uyghurs and ethnic minorities.
The methods governments use to detect and fingerprint circumvention tools like VPNs, including a mechanism to identify specific individuals as known VPN users.
There are many more, but two takeaways for me from this are:
This leak provides technical proof of the surveillance-for-profit ecosystem, empowering research groups to build technical cases for sanctions and accountability against vendors (Geedge Networks) and linked telecomms companies (like those exposed in Myanmar) that use the technology.
While this isn’t the first time we have learned of the commercial nature of digital oppression, it confirms sophisticated repression is a global, commercial venture. By mapping supply chains with this detail, we can move from simple reporting to truly understanding these systems.
Closing Note
If the Technical Teardown on building your own KML grabbed your attention in this newsletter, you might enjoy how I apply that same practice to my personal life. The idea for that process was inspired by a YouTube tutorial I made which focusses on mapping local water stations and public toilets for when I go for a run. It’s also useful if you’re into hiking or simply looking for quirky features to discover in your area.
I’m genuinely excited to be launching this newsletter, and I’d love to know what OSINT topics you’re struggling with or want to see covered next. Feel free to hit reply and let me know.
Thanks for joining here and make sure to subscribe for the next one, Ben.
Many thanks. Great work.