
OSINT Field Notes #4
Film geolocation, hybrid warfare, laptop farms, broken redactions, and the camera map that did not come from Brown.
Welcome to the fourth edition of OSINT Field Notes and the first one for 2026.
Over the holidays, between trying to switch off and still doomscrolling the news, I’ve been thinking about how quickly “evidence” turns into “story”. A PDF gets shared and people assume the black boxes mean the sensitive bits are gone. A map appears and suddenly it’s framed as an official release, even when it’s just a community layer sitting on top of public data. The hard part of OSINT is rarely the clever trick. It’s the boring work of provenance.
This issue leans into that. The Dispatches range from cultural geolocation and no-code scraping to hybrid incident mapping and the realities of exposed surveillance infrastructure. The Toolkit is a simple Google query for pulling satellite-backed location finds. The Technical Teardown is a workflow for auditing PDFs: redactions, metadata, and checking older versions via the Wayback Machine. And the Case File is a straight provenance lesson on the viral “Brown published its camera map” claim and why that framing was wrong.
Thanks again for all the support, and for the messages about how these workflows are turning up in your own investigations. That’s what keeps this going.
Ben.
1. Dispatches
This month’s dispatches are a mix of live conflict monitoring, slow-burn investigations, and a few reminders that OSINT muscle gets built in unexpected places.
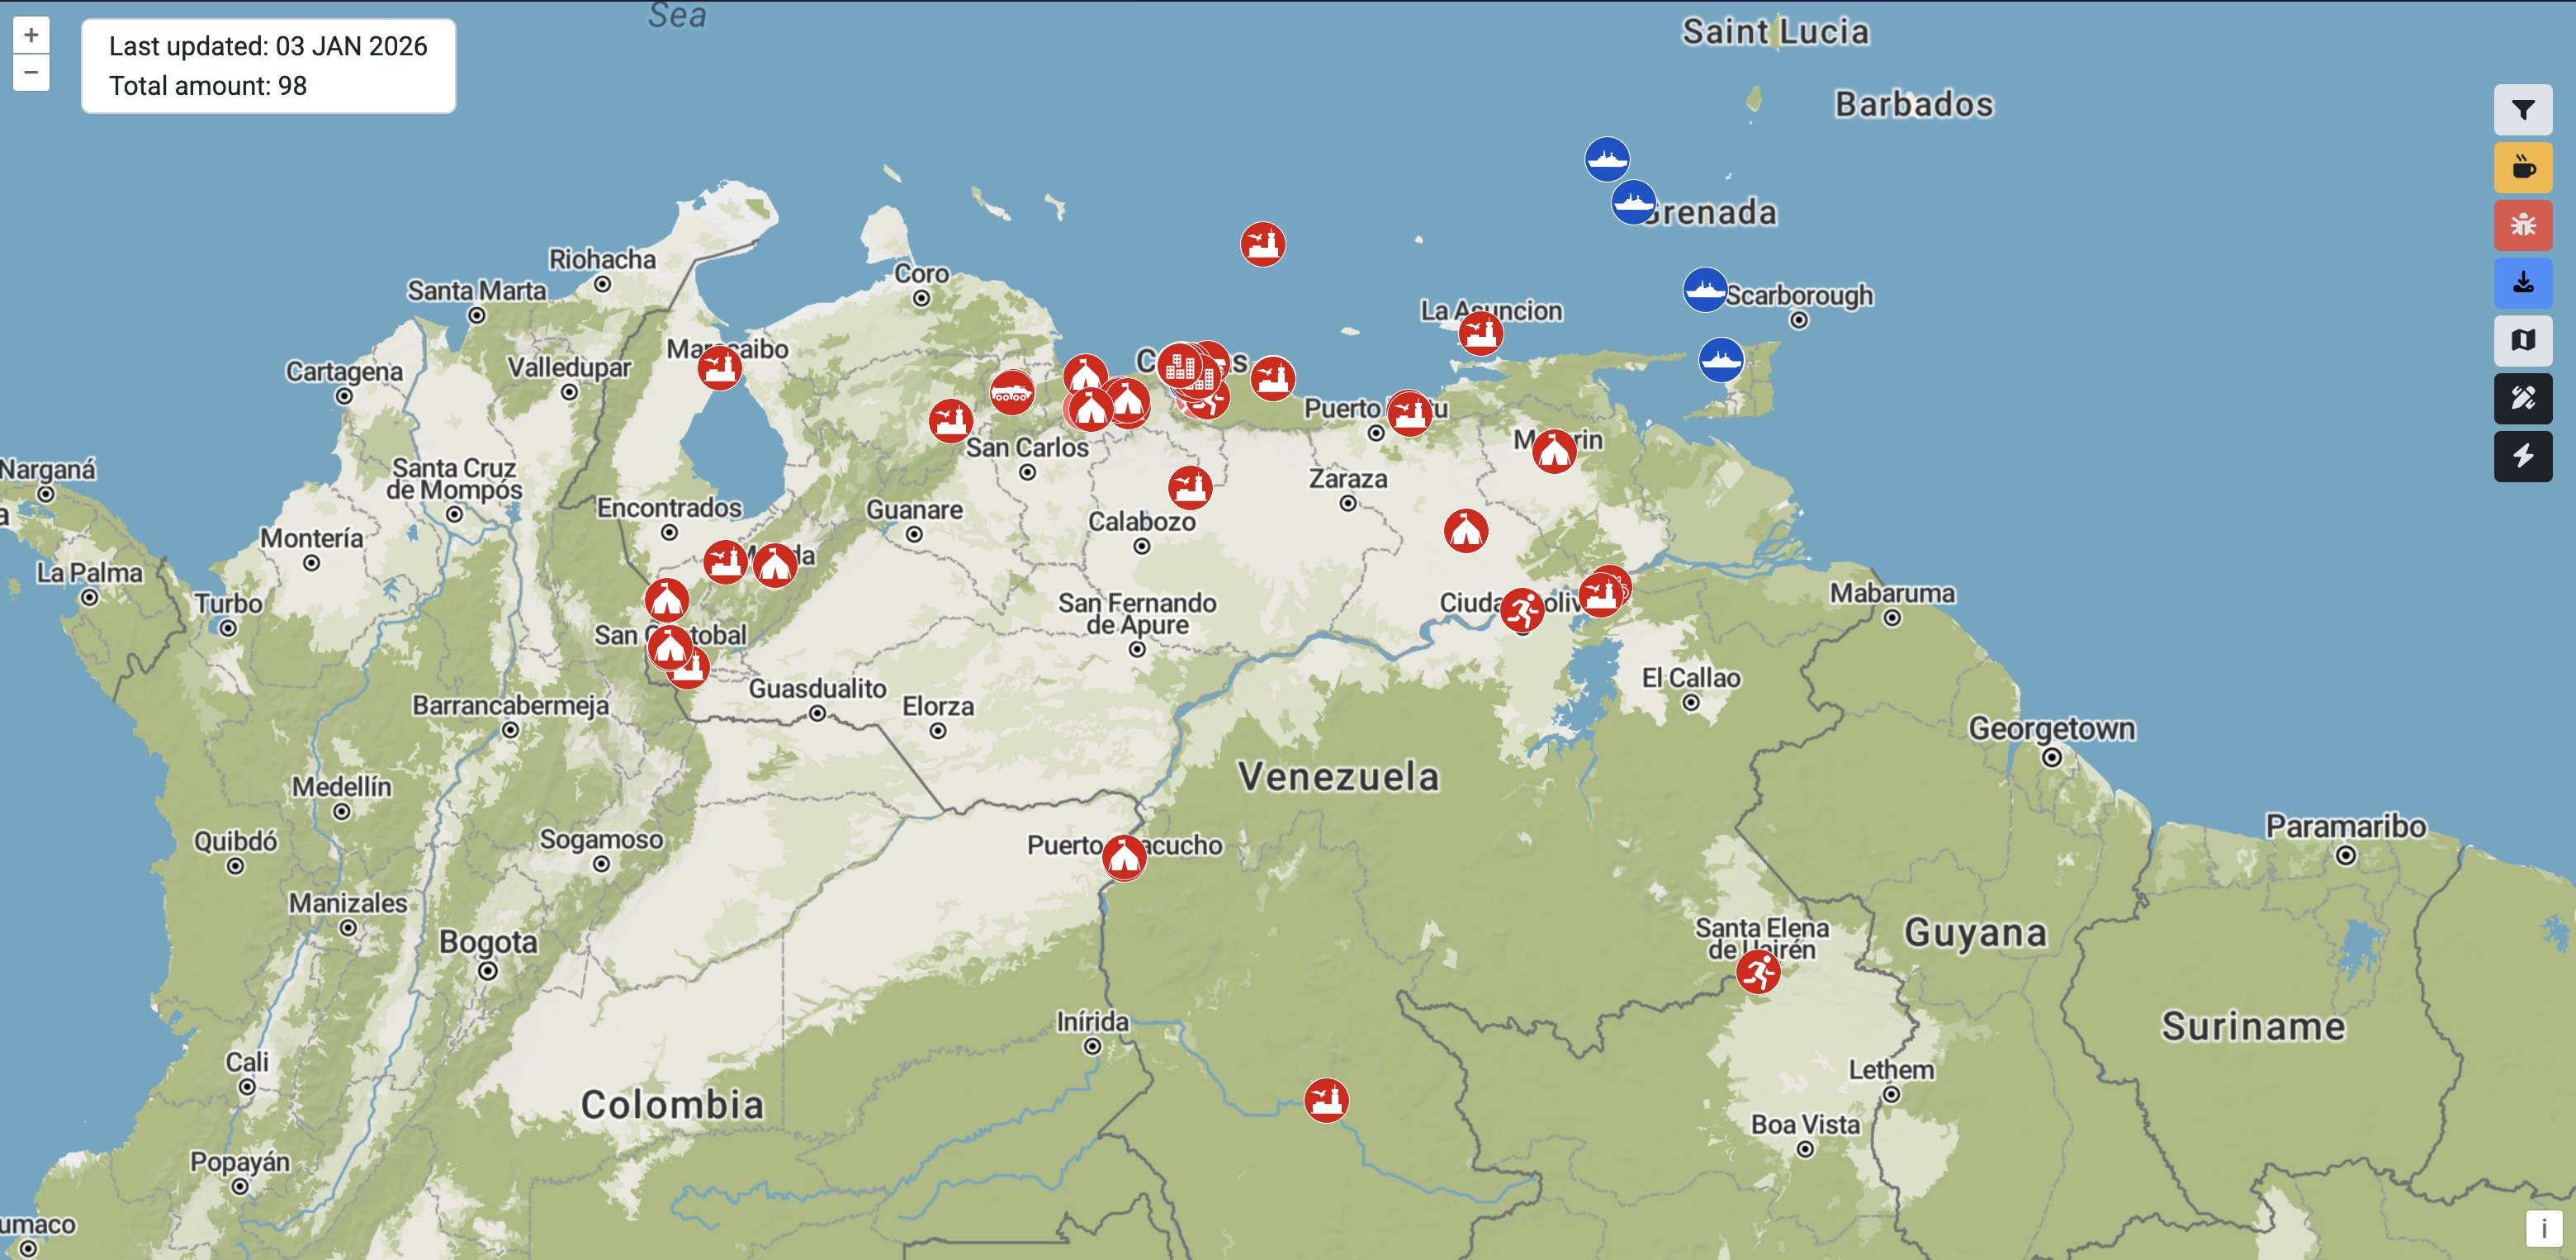
Geolocating footage from Venezuela
With multiple crowdsourced efforts working to geolocate and verify events in Venezuela, it’s easy to lose track. Two useful starting points are Geoconfirmed’s community geolocations and a volunteer-built map of Venezuelan military infrastructure. Treat both as leads, not conclusions and make sure to double check crowdsourced content.
Hacker Takes Down Far-Right Dating Website Live
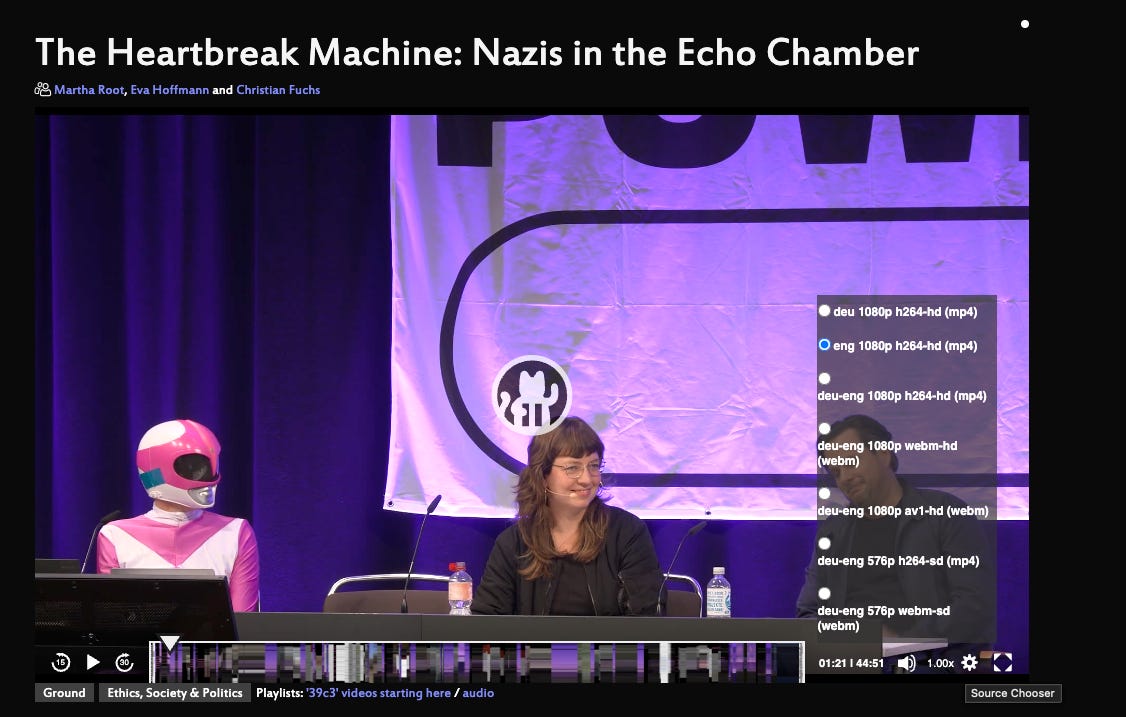
A German researcher known as Martha Root had infiltrated a white supremist dating site, ran an AI chatbot to extract as much information from users as possible, downloaded every profile, uncovered the owner of the site and published everything. The entire process and findings are featured in this 39th Chaos Communication Congress (39C3) recording.
The 39C3 talk is worth watching as a case study in how automation, scraping, and careful OSINT can expose extremist infrastructure and identities. If you don’t speak German, no problem, there’s a dubbed track for English that you can select through the little gear in the bottom right of the viewer (see screenshot below). What matters here isn’t the stunt, it’s the discipline throughout: observe, collect, validate, attribute, then document.
As a result of the investigation and data collection, the domain okstupid.lol was set up which maps any of the geotagged information, such as profiles, images with EXIF data and so on. Oh, and stick around for the end where Martha deletes the sites, its socials and all of its accounts.
North Korea IT workers in US companies
A YouTube breakdown from Bloomberg Investigations of the North Korean “laptop farm” model shows how remote hiring can be exploited at scale: proxy devices, proxy identities, and real salaries flowing to sanctioned actors. I’m sure there’s a lot of takeaways from this investigation, but one glaring one that stuck out to me was how this person was posting content on social media every day, talking about their work and at the same time, racks of laptops always visible in the office. Backgrounds matter. Repeated environments, equipment, and setups are often patterns hiding in plain sight.”
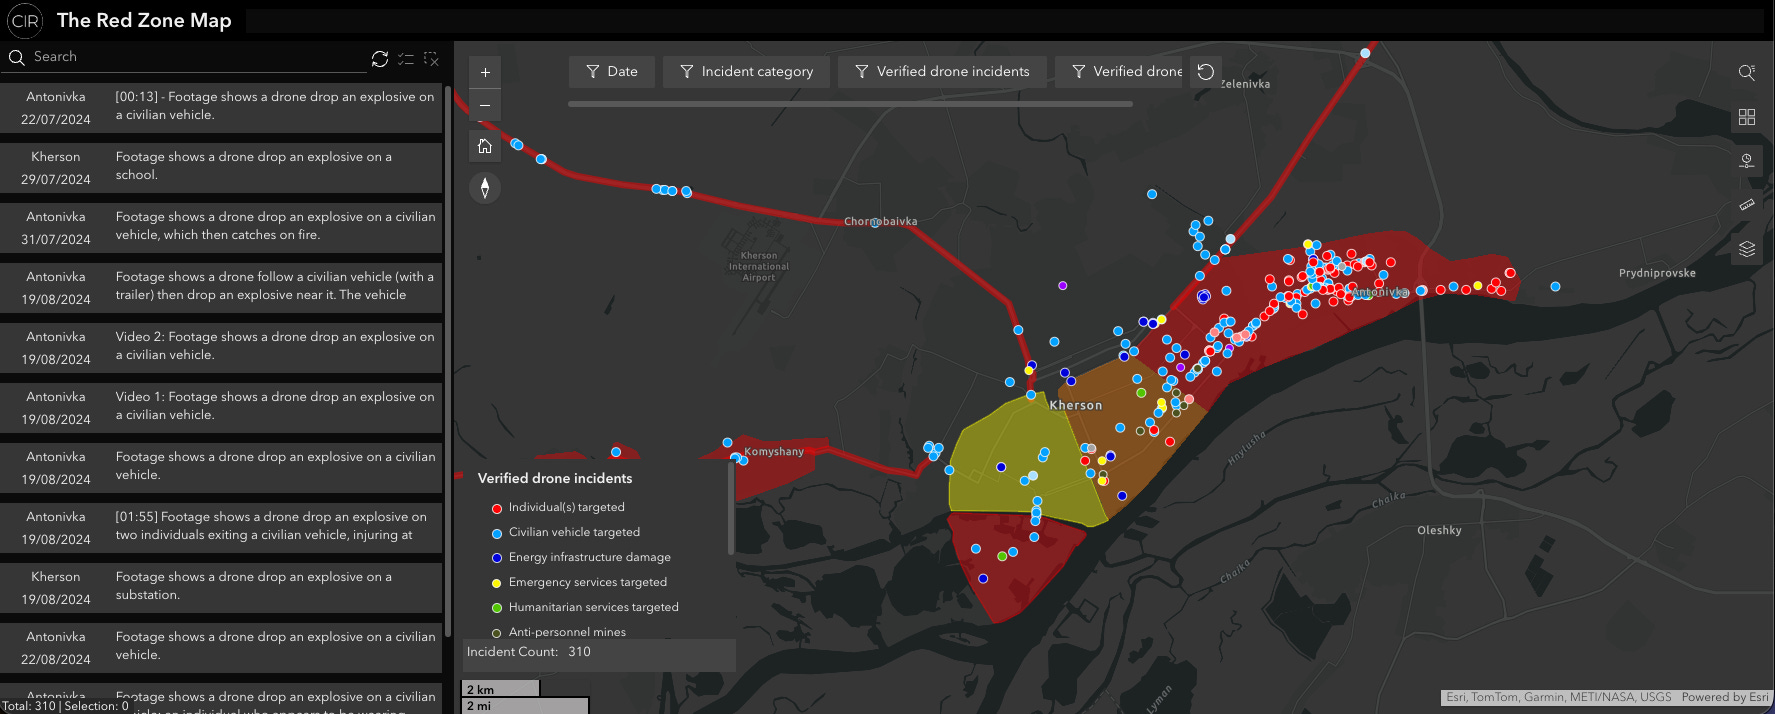
The Red Zone Map: drone attacks in Kherson, logged and filterable
CIR has published an interactive “Red Zone” map tracking Russian drone attacks in a declared area of Kherson and Antonivka. It covers CIR-verified incidents since July 2024 and records 317 verified attacks as of December 2025, with filters for date range, incident type, and munition type, plus a timeline view. The methodology is public, and the map works both as evidence and as a starting point for spotting patterns that don’t show up in daily reporting.
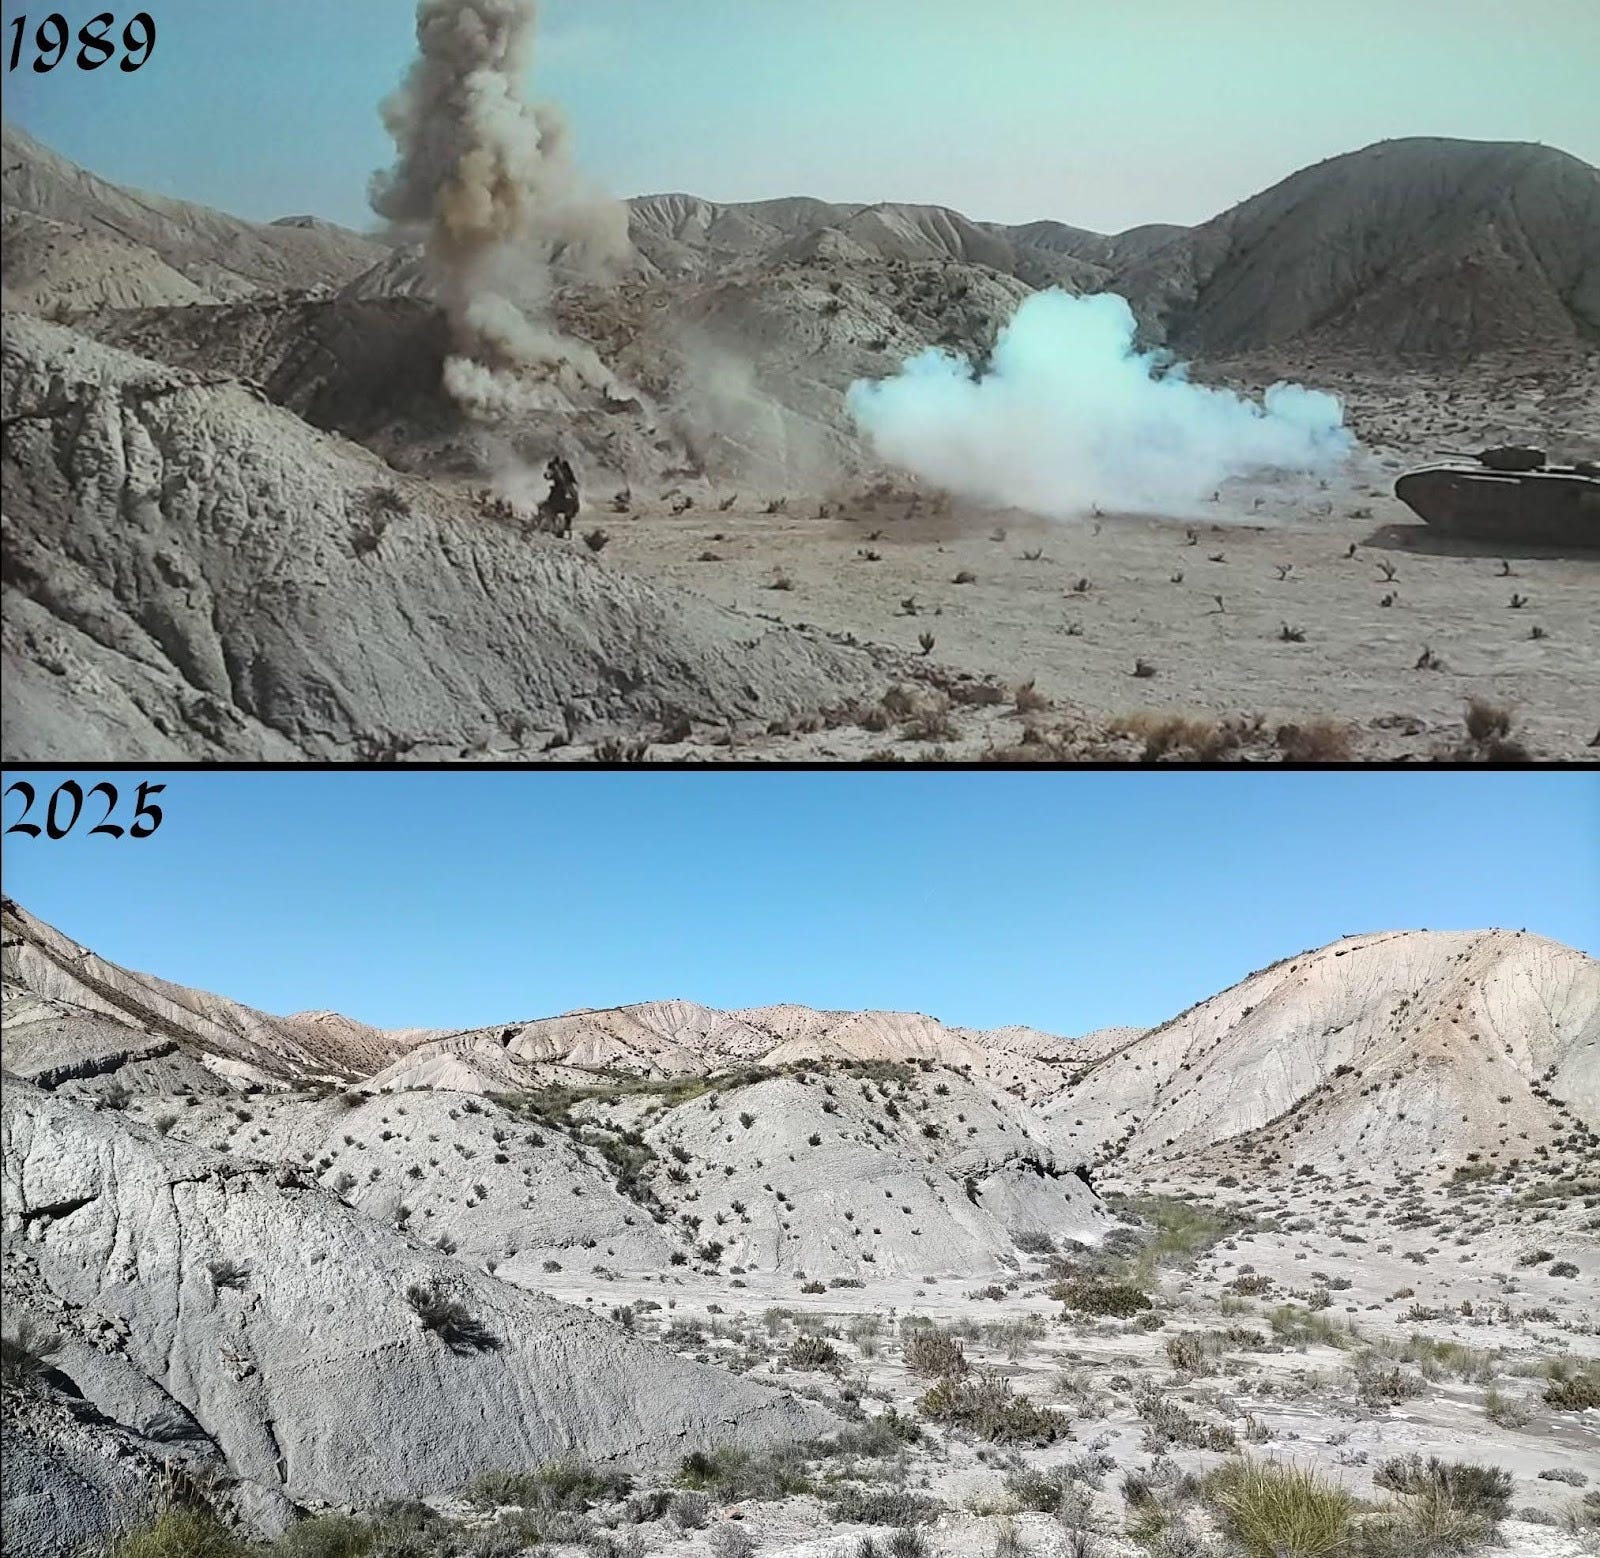
Film locations: “Indiana Jones and the Last Crusade”
Film buffs can make some of the best geolocators, and this geolocation seen on the Facebook page ‘Historic Film Locations’ is grand. It is a scene from Indiana Jones and the Last Crusade, located in the Plain of Trujillo and Gádor in Almería, Spain. Cracking geolocations like this are a reminder to treat old stills like evidence, build a reference stack, then prove the match with terrain and structure, not vibes.
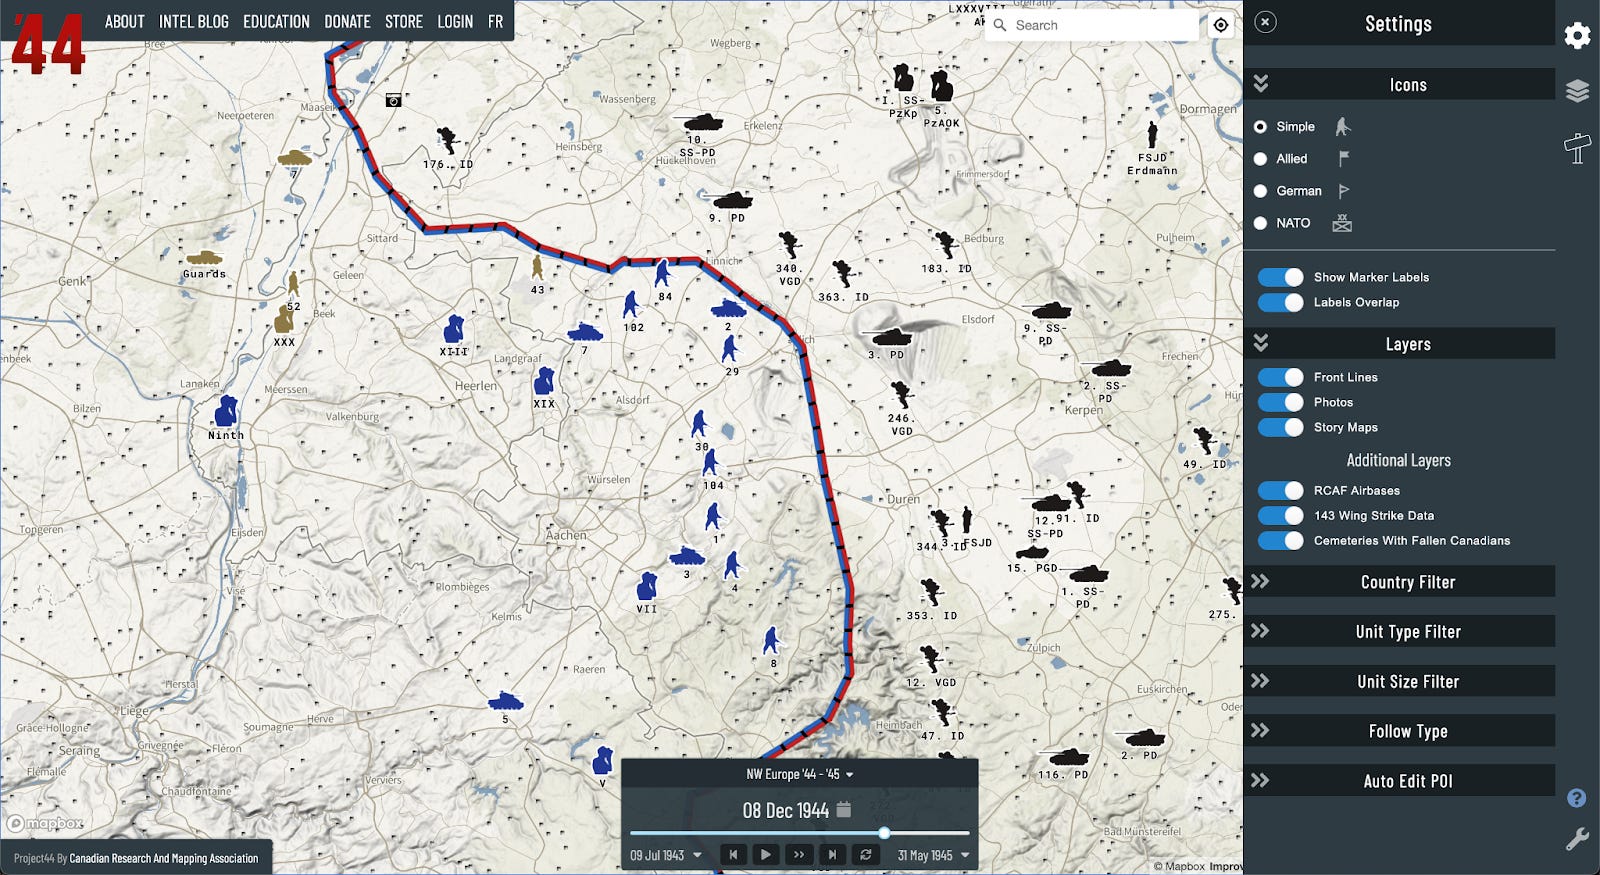
WW2 War Map
Project ’44’s WW2 mapping project has more than 70,000 points of data that lets you see every location a unit was ever recorded at. This is exactly the kind of “history OSINT” tool that ends up becoming a teaching resource and a memorialisation of events that happened in the past. There are more developments in the pipeline for the map which is already a serious platform for campaign analysis, not just a curiosity.
No-Code Webscrapers for Journalists
While it was from October, so a bit outdated for the Dispatches section for December, I feel like the GIJN’s guide on scrapers for non-coding journalists is a strong practical bridge for people who do not want to live in Python all day but still need structured data out of messy sites. What this resource establishes is scraping is not magic, it’s just making a repeatable ‘collect > clean > export’ pipeline, and LLMs can help you draft the first version fast if you still verify what it’s actually pulling.
Image Whisperer to Check AI Images
I’ve seen Image Whisperer shared as another tool in the growing “is this synthetic?” ecosystem. The way to use these tools is as triage, not a verdict. It’s helpful to trial it out on a few images before you’re going to rely on it, but always remember that when it comes to tools that use automated checks: run it, note the flags, then do the human checks that matter (reverse image, provenance, lighting/shadows, scene logic). When I tested it, the tool surfaced similar images, possible locations, and prior fact-checks. Useful signals, but still just signals.
AP - Hybrid War Map of Russian Sabotage
AP’s interactive mapping of suspected sabotage incidents linked to Russia is a useful reference spine for hybrid work. Even if attribution is contested case-by-case, the patterning is the story: clustering, target types, and timing against political events. The mapping itself reveals patterns that might be a useful pivot for further investigations, as well as routine monitoring for trends, channels and events that might not appear as anything out of the ordinary, at least on the surface, until further research is conducted.
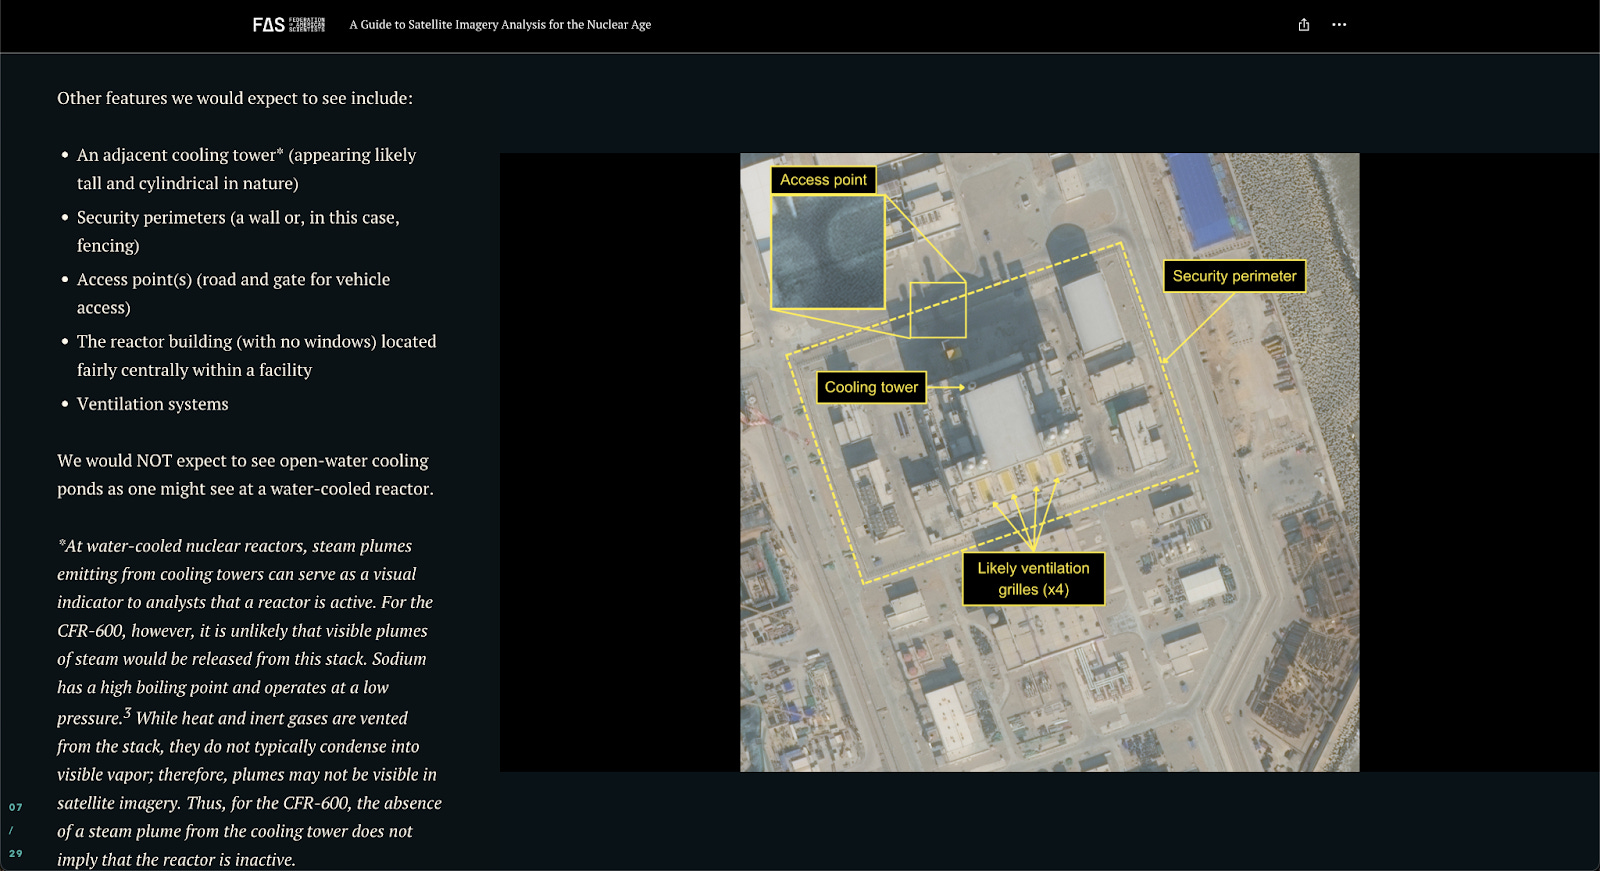
FAS - A Guide to Satellite Imagery for the Nuclear Age
This Guide to Satellite Imagery Analysis for the Nuclear Age is a genuinely solid “how to think” piece for imagery analysis, using a reactor facility case study to walk from context to collection to conclusions. The full guide is a 20-page PDF, which can be found here, but there’s also a really nice StoryMap that has been made for a more visually compelling guide. It’s not about magic tools, it’s about disciplined interpretation, and that scales to almost any imagery problem.
Flock Cameras
404 Media and others showed how misconfigured surveillance feeds can end up exposed in the open internet. The vulnerabilities were effectively revealed in this YouTube video runthrough of the investigation. The lesson out of this is uncomfortable but practical: massive surveillance infrastructure often has weak security, and configuration mistakes can create real-world risk for ordinary people.
Another tangent to the investigation led me to finding DeFlock, which is a crowdsourced map of the surveillance infrastructure so the public can see what is otherwise invisible. Even if the dataset is incomplete, the method is the point: shared tagging standards, public contribution, and a map that makes patterns legible.
2. From the Toolkit
This month’s quick tool is a simple Google query for finding OSINT-backed location reporting:
(”satellite imagery” OR “Planet Labs” OR “Maxar”) (geolocat* OR “identified” OR “researchers find”) (airbase OR convoy OR port OR “mass grave”) after:2025-12-01 before:2026-01-01
Getting hold of commercial satellite imagery is usually the bottleneck. This query helps you piggyback on reporting where imagery has already been published.
3. Technical Teardown: [Un]redact
Quick note before we start: I’m not going to walk through extracting concealed personal data from redactions. What I will do is show you how to audit a PDF, spot unsafe redactions, pull metadata, and find older public versions for provenance checks.
Okay, first I want to draw your attention to a recent headline from Forbes in the image below. My attention was drawn to this when someone messaged me saying “Hey Ben, how do I hack a PDF?” and sent me a link to this article.
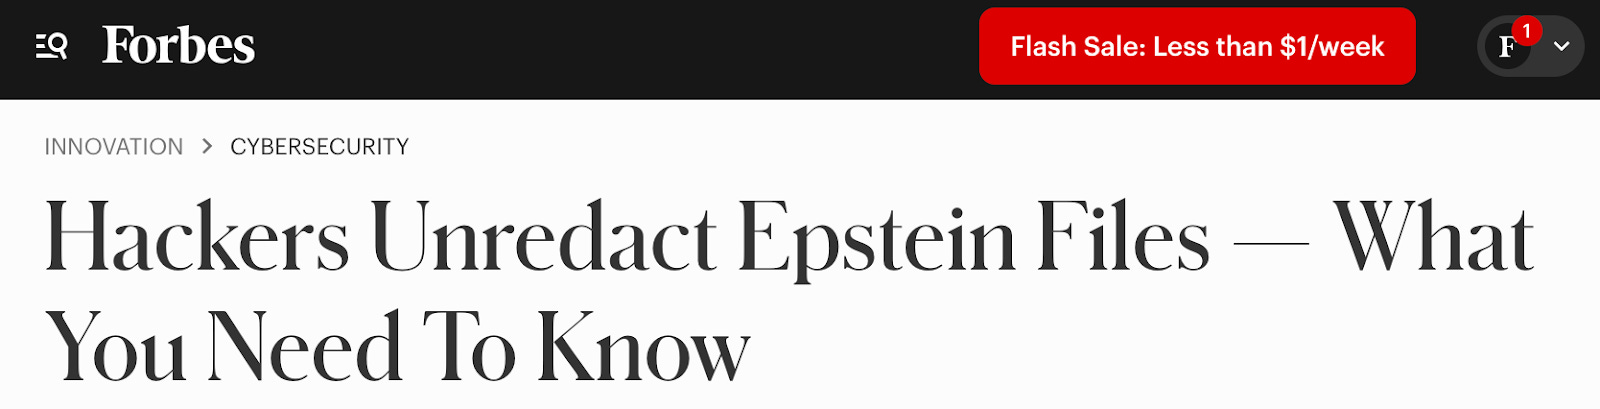
Well, my secret to anything on the internet is just to pay attention. In the article, for example, it even spells out how the PDFs ‘were hacked’.
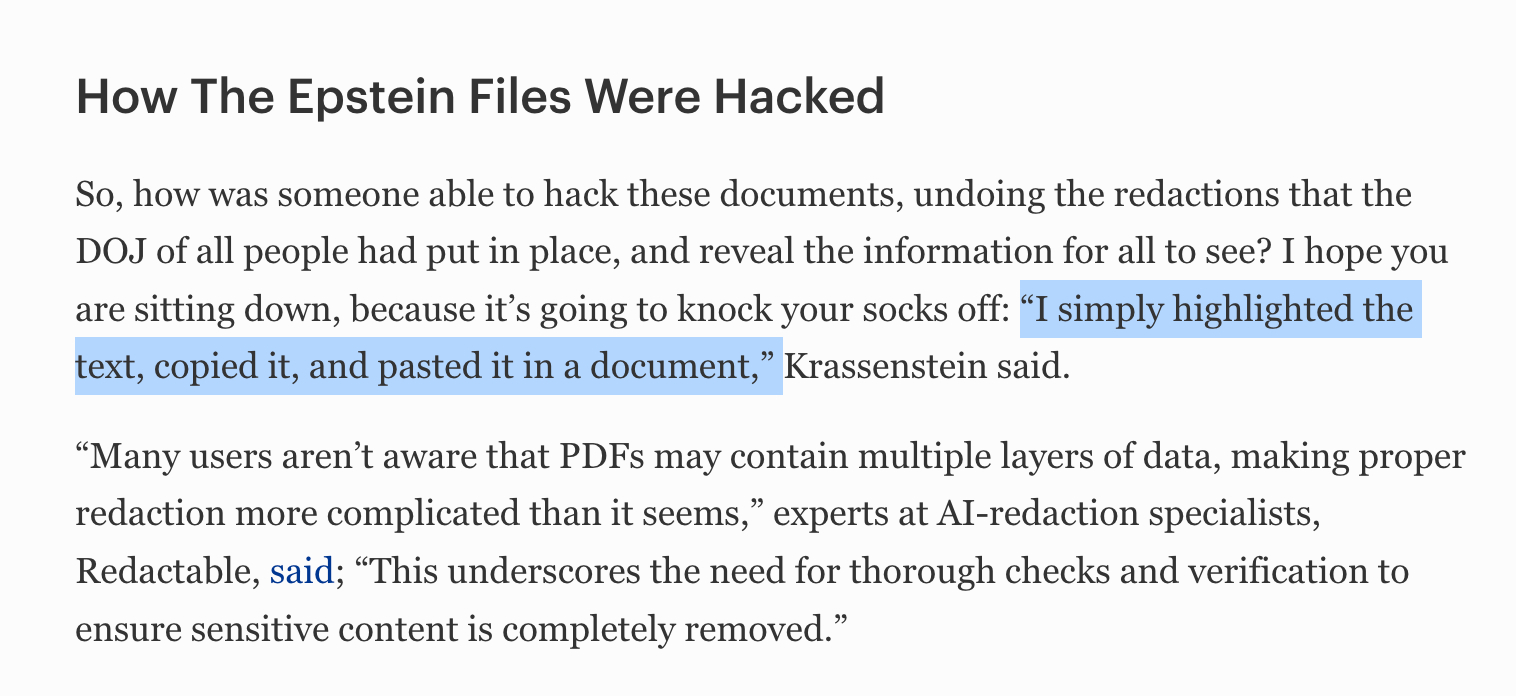
That framing matters, because nothing here involved hacking. It was a publishing failure. So let’s test that in action. There’s a useful Reddit thread on exactly this, focussing on the Epstein releases.
One of the documents is on the Wayback Archive here. Using documents that are preserved on Wayback are useful due to them being reuploaded to their original domains after the loopholes were identified.
I’ve made a YouTube tutorial on the Wayback Machine and the Internet Archive, both of those are completely underrated and underutilised resources.
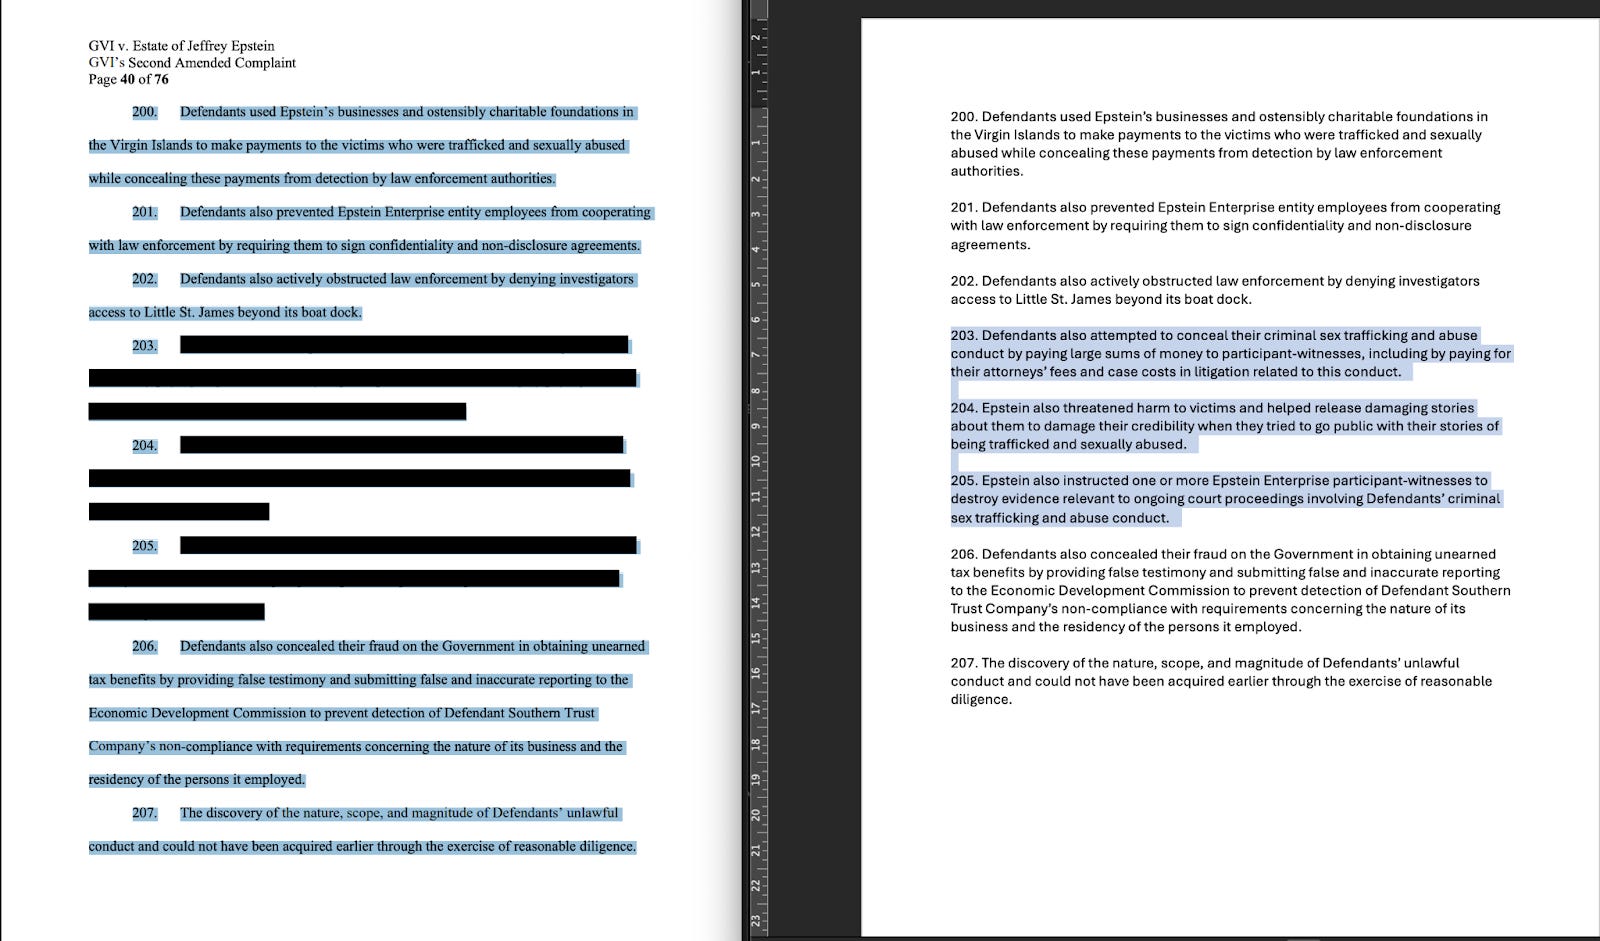
If we look at page 40 of the linked document, we can see the redactions on that page. But with a copy and paste, the redactions are removed. That’s because the redaction wasn’t really a redaction but rather a ‘layer’ over the text. In this case the layer was a black box.
Okay, so that’s pretty straightforward. How can we tell if this has happened on a document? Well there’s three simple checks you can do:
Try highlighting across a redaction block. If the selection behaves strangely, that’s a warning sign.
Try searching for a known nearby word or phrase. If search hits inside a “covered” area, the content might still exist.
Check whether the “redaction” looks like a simple filled rectangle sitting on top of text.
What else can be found within PDF documents? Well there’s also the metadata of a document. If you can download the PDF, metadata might tell you more than people expect. For example you might find creator software, producer, creation/modification times, and sometimes workflow indicators.
Some tools you can use to view that content are:
Online metadata viewers such as Metadata2Go -but do be careful when using online sites with sensitive documents as you don’t always know who you’re sharing with.
Command line viewers such as ExifTool - which is a much safer approach and only observes the data through your machine rather than any reliance on cloud or web-based activity.
I made a tutorial on how to view metadata on documents, as well as images, a few years back. Specifically, there’s a walkthrough on how to use ExifTool here. While it is command-line based, don’t let that intimidate you, as once you have it installed, it really is just a drag and drop process.
4. Case File: Mistaken Data Identity
In mid-December, a familiar kind of internet story took off.
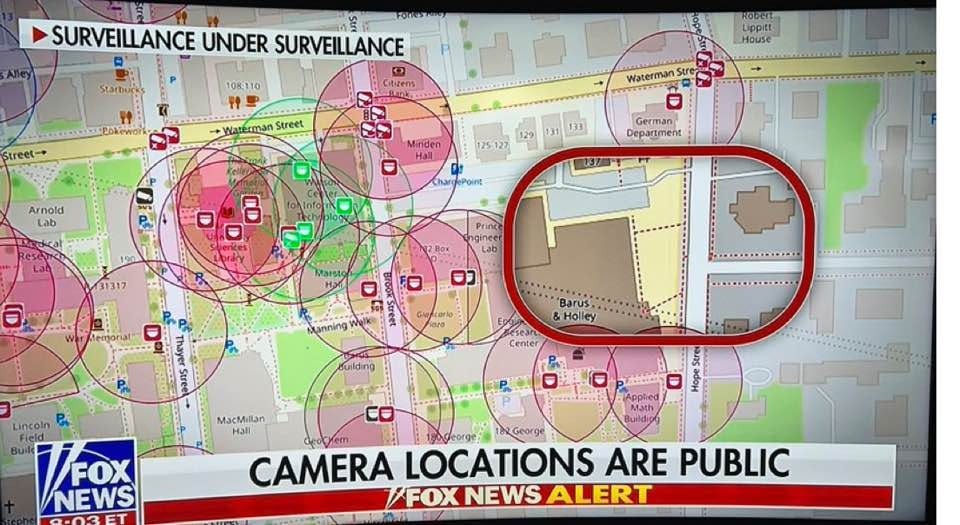
As cable news coverage accelerated, a screenshot of a surveillance camera map began circulating online.
Social media built on the Fox News piece, claiming the camera plan was published or put online by the university and “published its camera plan for the world to see”.
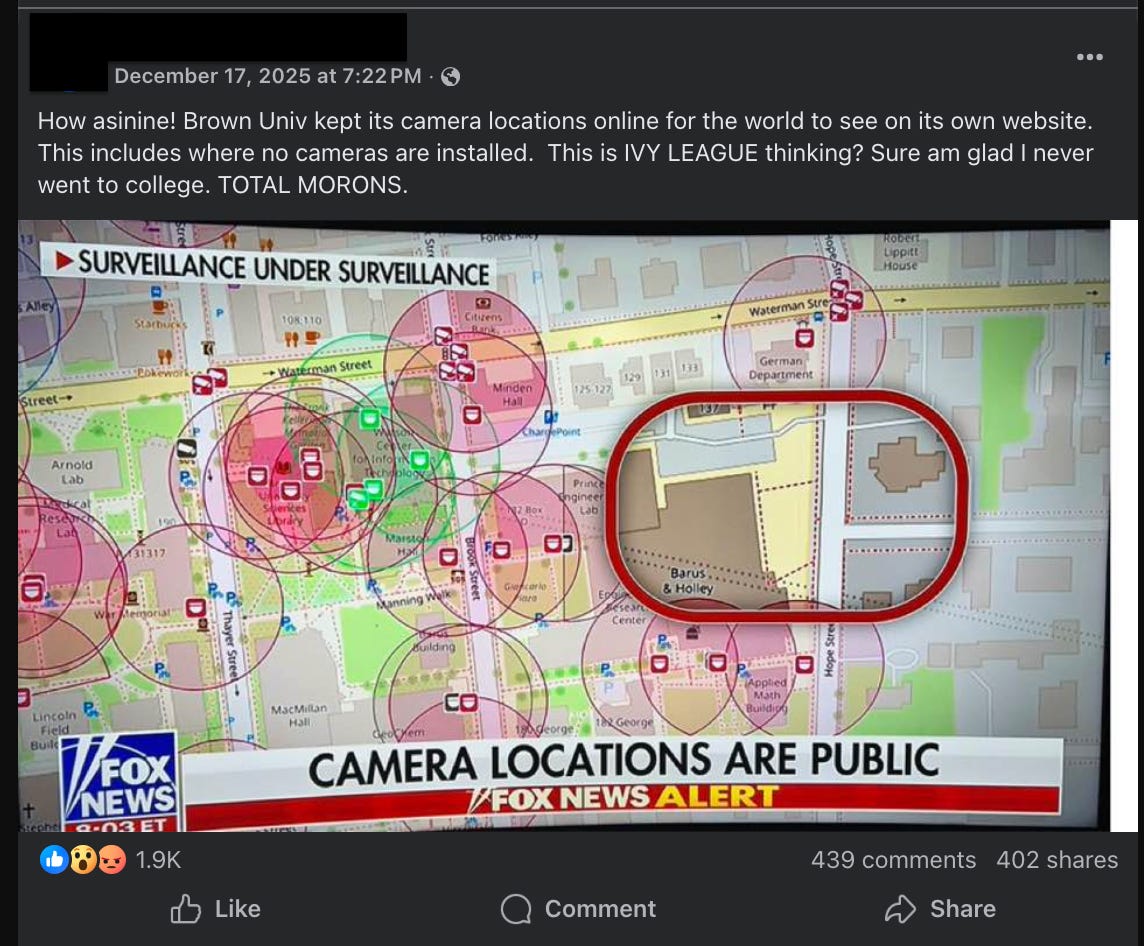
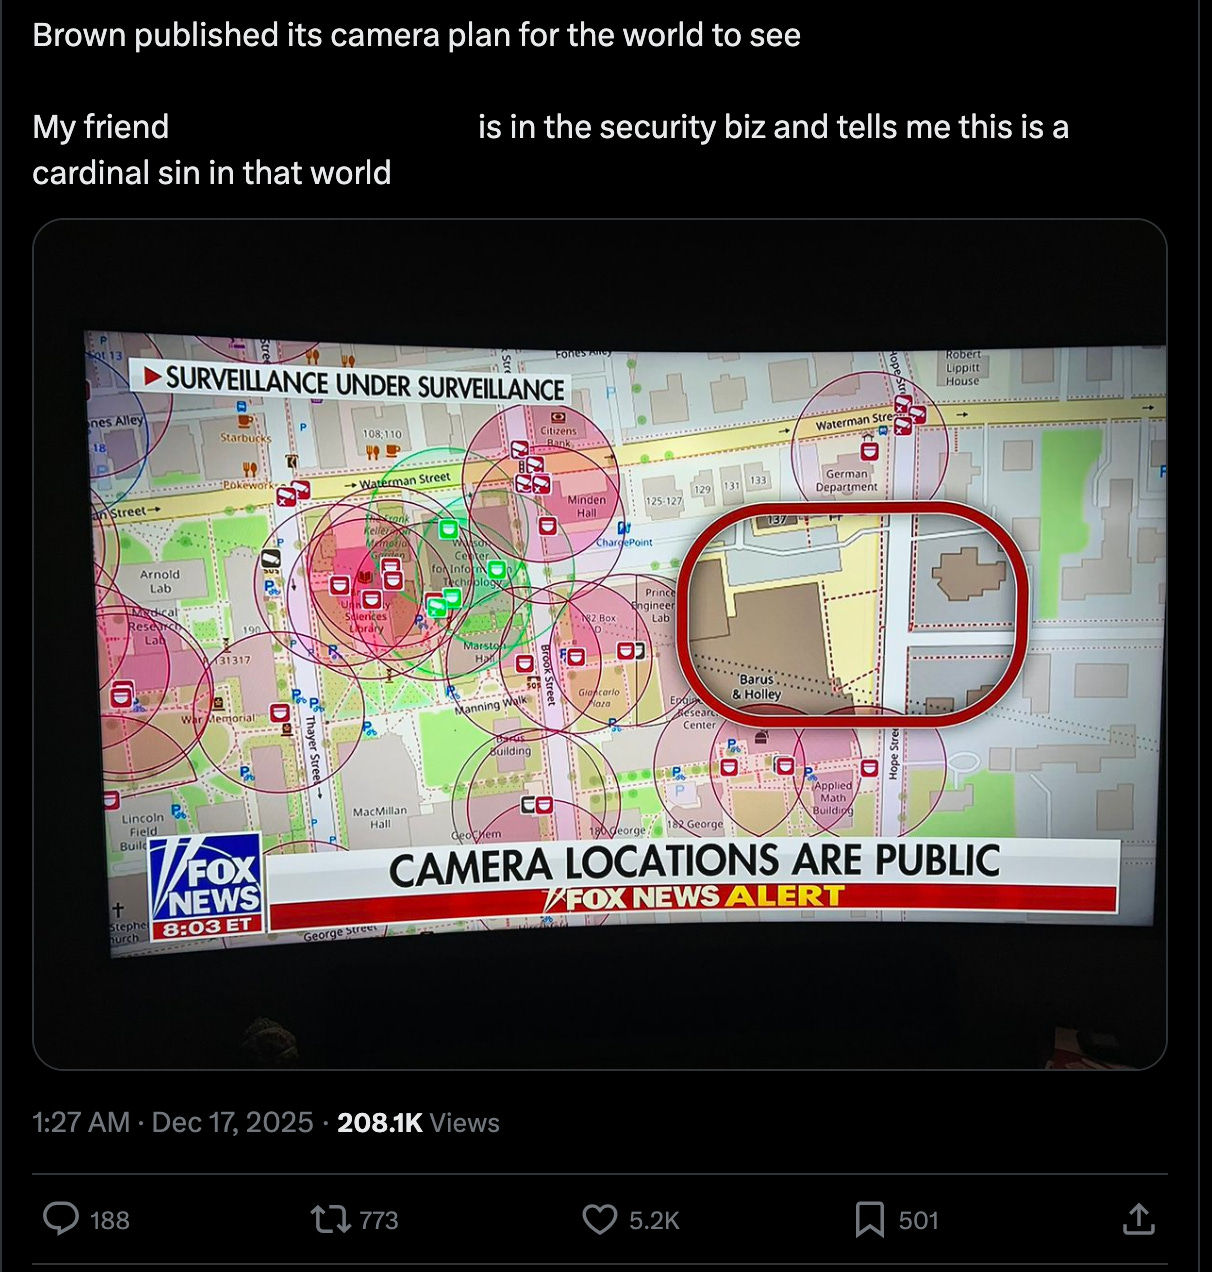
That framing matters, because it turns a general point about surveillance into a very specific accusation: that an institution published an operational security blueprint. It also gives commentators a clean villain and a simple story. The problem is the provenance.
The map being shared was not hosted by Brown University. It was Surveillance under Surveillance, a community project that visualises surveillance-related entries sourced from OpenStreetMap contributors.
The site is explicit about this, it states: “Surveillance under Surveillance uses data from OpenStreetMap contributors that is not visualised on the regular OpenStreetMap site”.
So the “Brown published it” claim is not true. A third-party map showing camera points in an area does not imply the institution “uploaded” those points. It implies that someone, at some point, mapped surveillance infrastructure in that area using open tagging conventions.
This is why the case matters. It is a clean example of a mistake that shows up everywhere in investigations and media:
Publicly accessible does not mean officially released.
A rendered map is not the dataset underneath it.
And data about a place is not the same as data published by that place.
The simple workflow that would work well in cases like this would be:
Domain: is it an official site or a third-party map? (Here it’s sunders.uber.space, not Brown.)
Source: read the “About” to find the upstream data (here it’s OpenStreetMap contributors).
Confirm: check the OSM tagging docs (e.g.
man_made=surveillance) to see it’s a standard, reusable data layer.Correct: say what’s true: it’s a community visualisation of OSM surveillance tags, not a university-issued camera map.
Closing Note
If there’s one habit to steal from this issue, it’s to treat every artefact like a container with a history. A PDF has layers, metadata, and older versions. A map has upstream data, renderers, and contributors. A viral claim usually strips all of that away.
A big thanks to the thousands of you for reading these each month. Wishing you a successful 2026.
See you in the next one,
Ben.
My career background is marketing and writing, and I've made the jump to investigation and hopefully will land a role in protective intelligence. Wanted to give you props for a great read AND some very helpful things to think about as a newbie. Thank you!