
OSINT Field Notes #5
Ships stealing names from the unbuilt, whale highways mapped like roads, a three-layer satellite stack and the $34 billion company arming Russia's airwaves.

Welcome to the fifth edition of OSINT Field Notes, a special edition for those seeking images from above.
Satellites have dominated this month. Shadow fleets caught from space despite killing their transponders, war and conflict captured from orbit, users’ traffic data resurfacing as geospatial products, and whale migration highways mapped through satellite tracking. Everything connects back to what we can see from orbit.
I recently published a tutorial on the best free satellite imagery tools available and the community came back with a wave of recommendations I had to share. So this edition’s Toolkit is an expanded geospatial roundup, after we run through this month’s dispatches, a technical teardown on stacking satellite sources in an investigation, and a case file on how U.S. networking hardware ended up powering Russia’s drone war.
Ben.
1. Dispatches
Newbuild identity theft in the shadow fleet
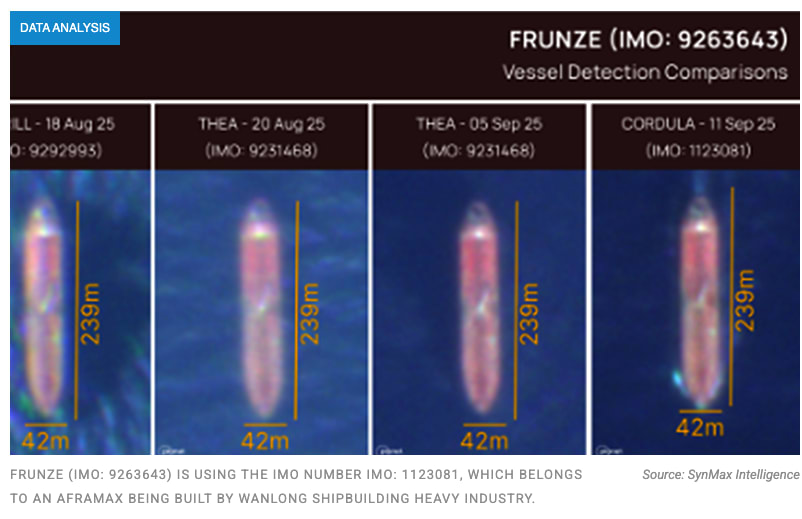
Sanctioned tankers are now stealing identities of ships still under construction. Lloyd’s List and SynMax Intelligence document the first known case: the sanctioned aframax (medium-sized oil tanker) Frunze transmitting using the IMO number of an aframax currently being built at Wanlong Shipbuilding in China. Unlike “zombie” tankers using scrapped vessel IMOs, newbuilds offer cleaner deception with no operational history or AIS tracks to conflict with.
Investigator takeaway: When screening suspicious tankers, cross-reference IMO numbers against newbuild databases, if the vessel is operational but its IMO belongs to a ship still in construction, you’ve found identity theft that’s harder to spot than traditional zombie tactics.
Snap Map as a rough connectivity proxy
Uganda’s pre-election shutdown and restoration became visible not just through network-monitoring reporting, but in public posting patterns too (BBC used it recently to identify the return of connectivity and activity in Uganda after internet shutdowns). Snap Map’s “hotspot” layer gives you a fast, messy-but-useful sense of where people are back online and uploading. You’ll need an account to access it.
Investigator takeaway: Pair “hard” reporting on shutdowns with “soft” signals like Snap Map hotspots to sanity-check timing and geographic unevenness.


ShadowFleet.xyz: sanctions-evasion monitoring on a map
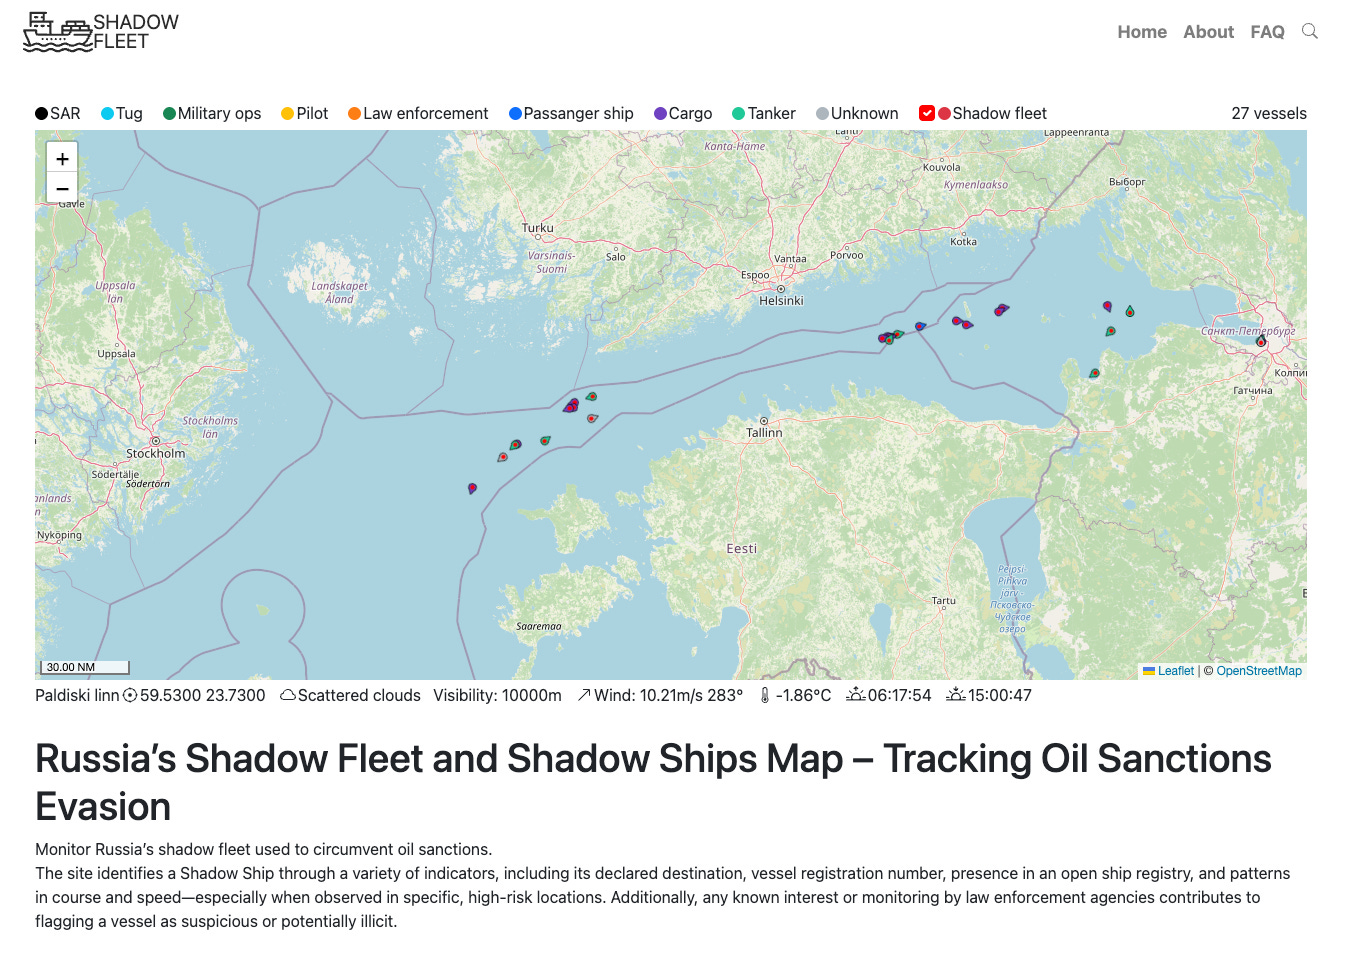
A clean, investigator-friendly map tracking Russia’s shadow fleet across the Baltic Sea, North Sea, Western Europe, Mediterranean, and Suez Canal. Vessels are flagged via behavioural and registry indicators: destinations, IMO patterns, suspicious navigation in high-risk locations (underwater cables, pipelines), and law enforcement interest. Built for quick triage rather than deep attribution.
Investigator takeaway: Use it as a watchlist starter, then pivot to your own corroboration. AIS history, ownership/flag churn, insurance, port call records, enforcement reporting. Treat the “shadow ship” label as a hypothesis you still need to evidence.
Waze “exposure”: crowdsourced traffic data has a people-risk side
A thread from January lays out a blunt point: user reports on Waze can expose granular location and timing signals at scale, because the public web map is designed to be queryable. It’s not framed as a bug. It’s the product.
Investigator takeaway: This is mainly a safety and ethics reminder. If you work with sensitive people or locations, assume traffic and “incident” apps can leak patterns of life. Don’t use this to target individuals. Do use it to harden operational security and educate people around platform leaks and data privacy.

Blue Corridors: whale migration mapped like infrastructure
BlueCorridors.org visualises decades of satellite tracking to show whale migratory pathways as “corridors”, with threat and conservation layers. It’s an example of how good interactive mapping turns a complex dataset into something you can reason with quickly.
Investigator takeaway: Steal the pattern, not the topic. This is a blueprint for making movement data legible: corridors, seasonal context, threat overlays, and exportable views that non-specialists can understand.


LinkedIn meets the Epstein documents
404 Media covered a tool that cross-references the released Epstein flight logs and associated documents against your LinkedIn network, flagging connections you’d otherwise miss.
Investigator takeaway: The technique is valuable. Cross-referencing leaked or public document sets against social platforms (LinkedIn, corporate registries, donor lists) is a repeatable pattern for any investigation: “document-to-network” matching. The ethical line: use it for accountability journalism and due diligence, not harassment or speculation.
Egypt’s Secret Drone Base Revealed Through Satellite Analysis
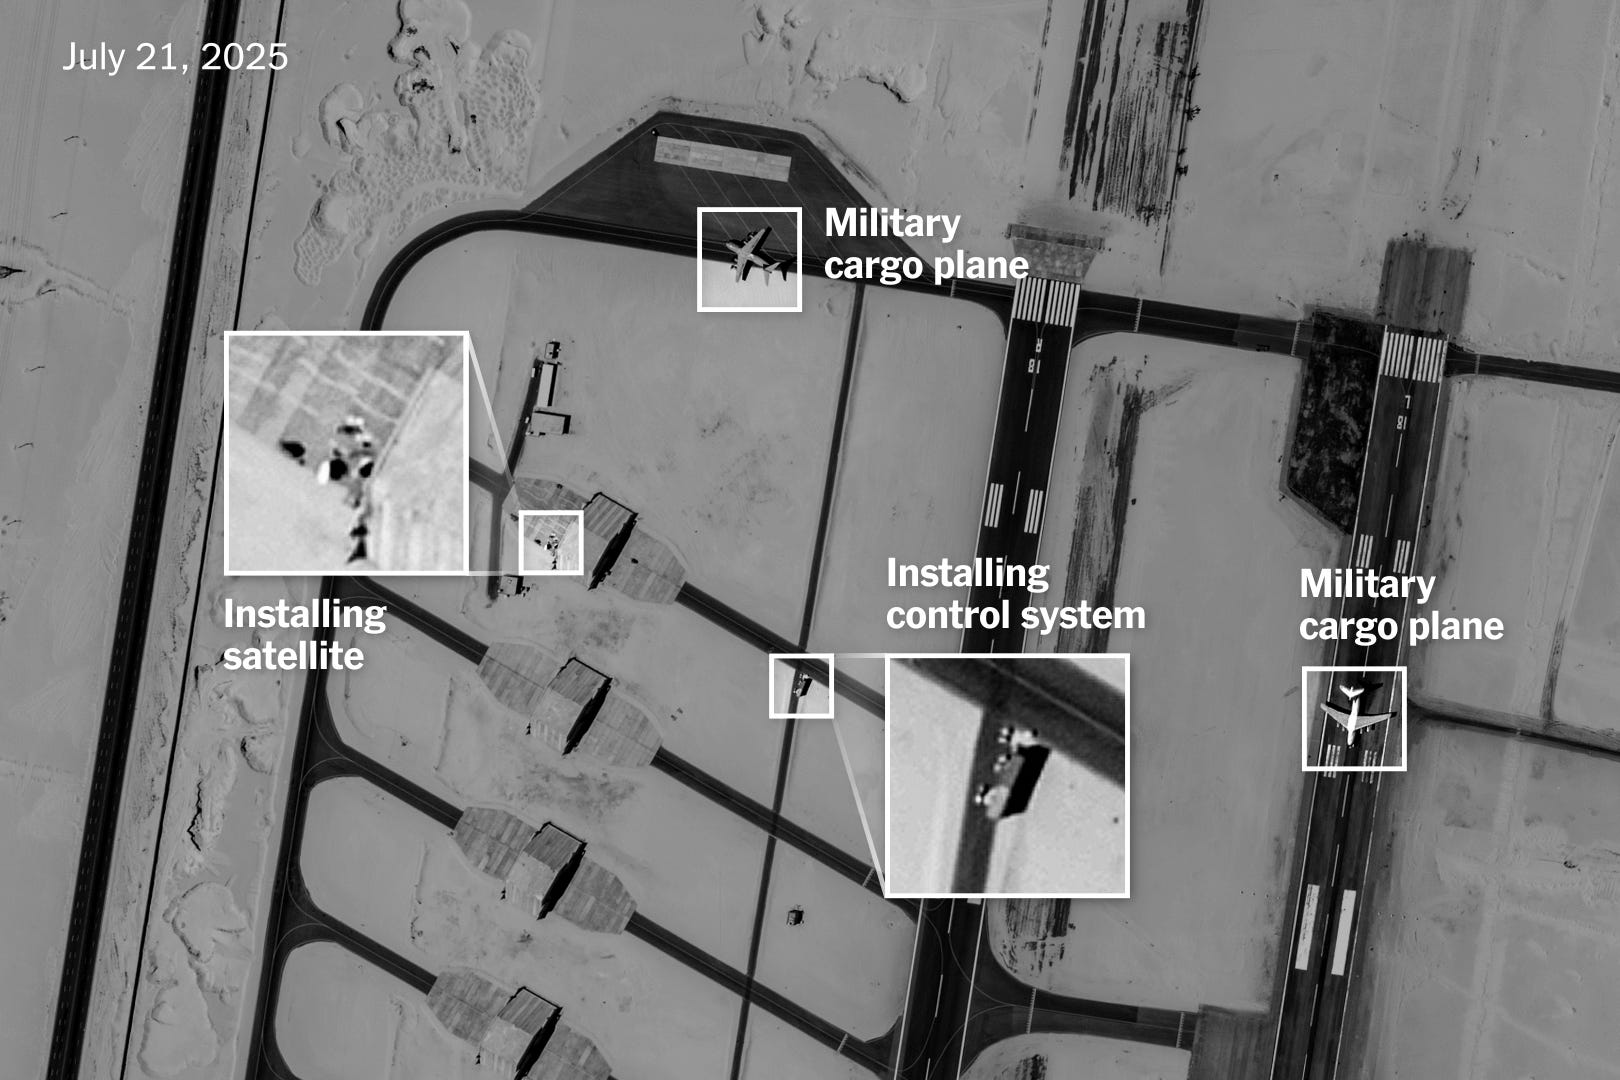
New York Times investigation uncovers a covert military drone facility at Egypt’s East Oweinat agricultural project, approximately 40 miles from Sudan’s border, where Turkish Akinci drones have been conducting long-range strikes against the Rapid Support Forces since late 2024. The investigation combines commercial satellite imagery from Planet Labs and Vantor with flight tracking data from Aireon, revealing the base’s expansion from a civilian airstrip to a 17-hangar military installation, with Turkish cargo flights delivering drone systems beginning in July 2025 and strike operations intensifying after the fall of El Fasher in October.
Investigator takeaway: This investigation demonstrates a multi-layer satellite research methodology, tracking infrastructure expansion over time (2014-2024 hangar construction), correlating cargo flight patterns with ground control system installation, then connecting specific munitions (Turkish Roketsan guided bombs) visible in strike footage to drone capabilities and operational range, proving attribution through converging technical evidence rather than single-source claims.
2. From the Toolkit
This month’s Toolkit goes wide. Instead of a single recommendation, I’m sharing a full stack of geospatial tools, many suggested by the community after I asked across platforms. Whether you’re trying to pin down a convoy route or just want a better basemap, there’s something here.
If you want to see a full visual guide on many of these tools, I made a YouTube tutorial here.
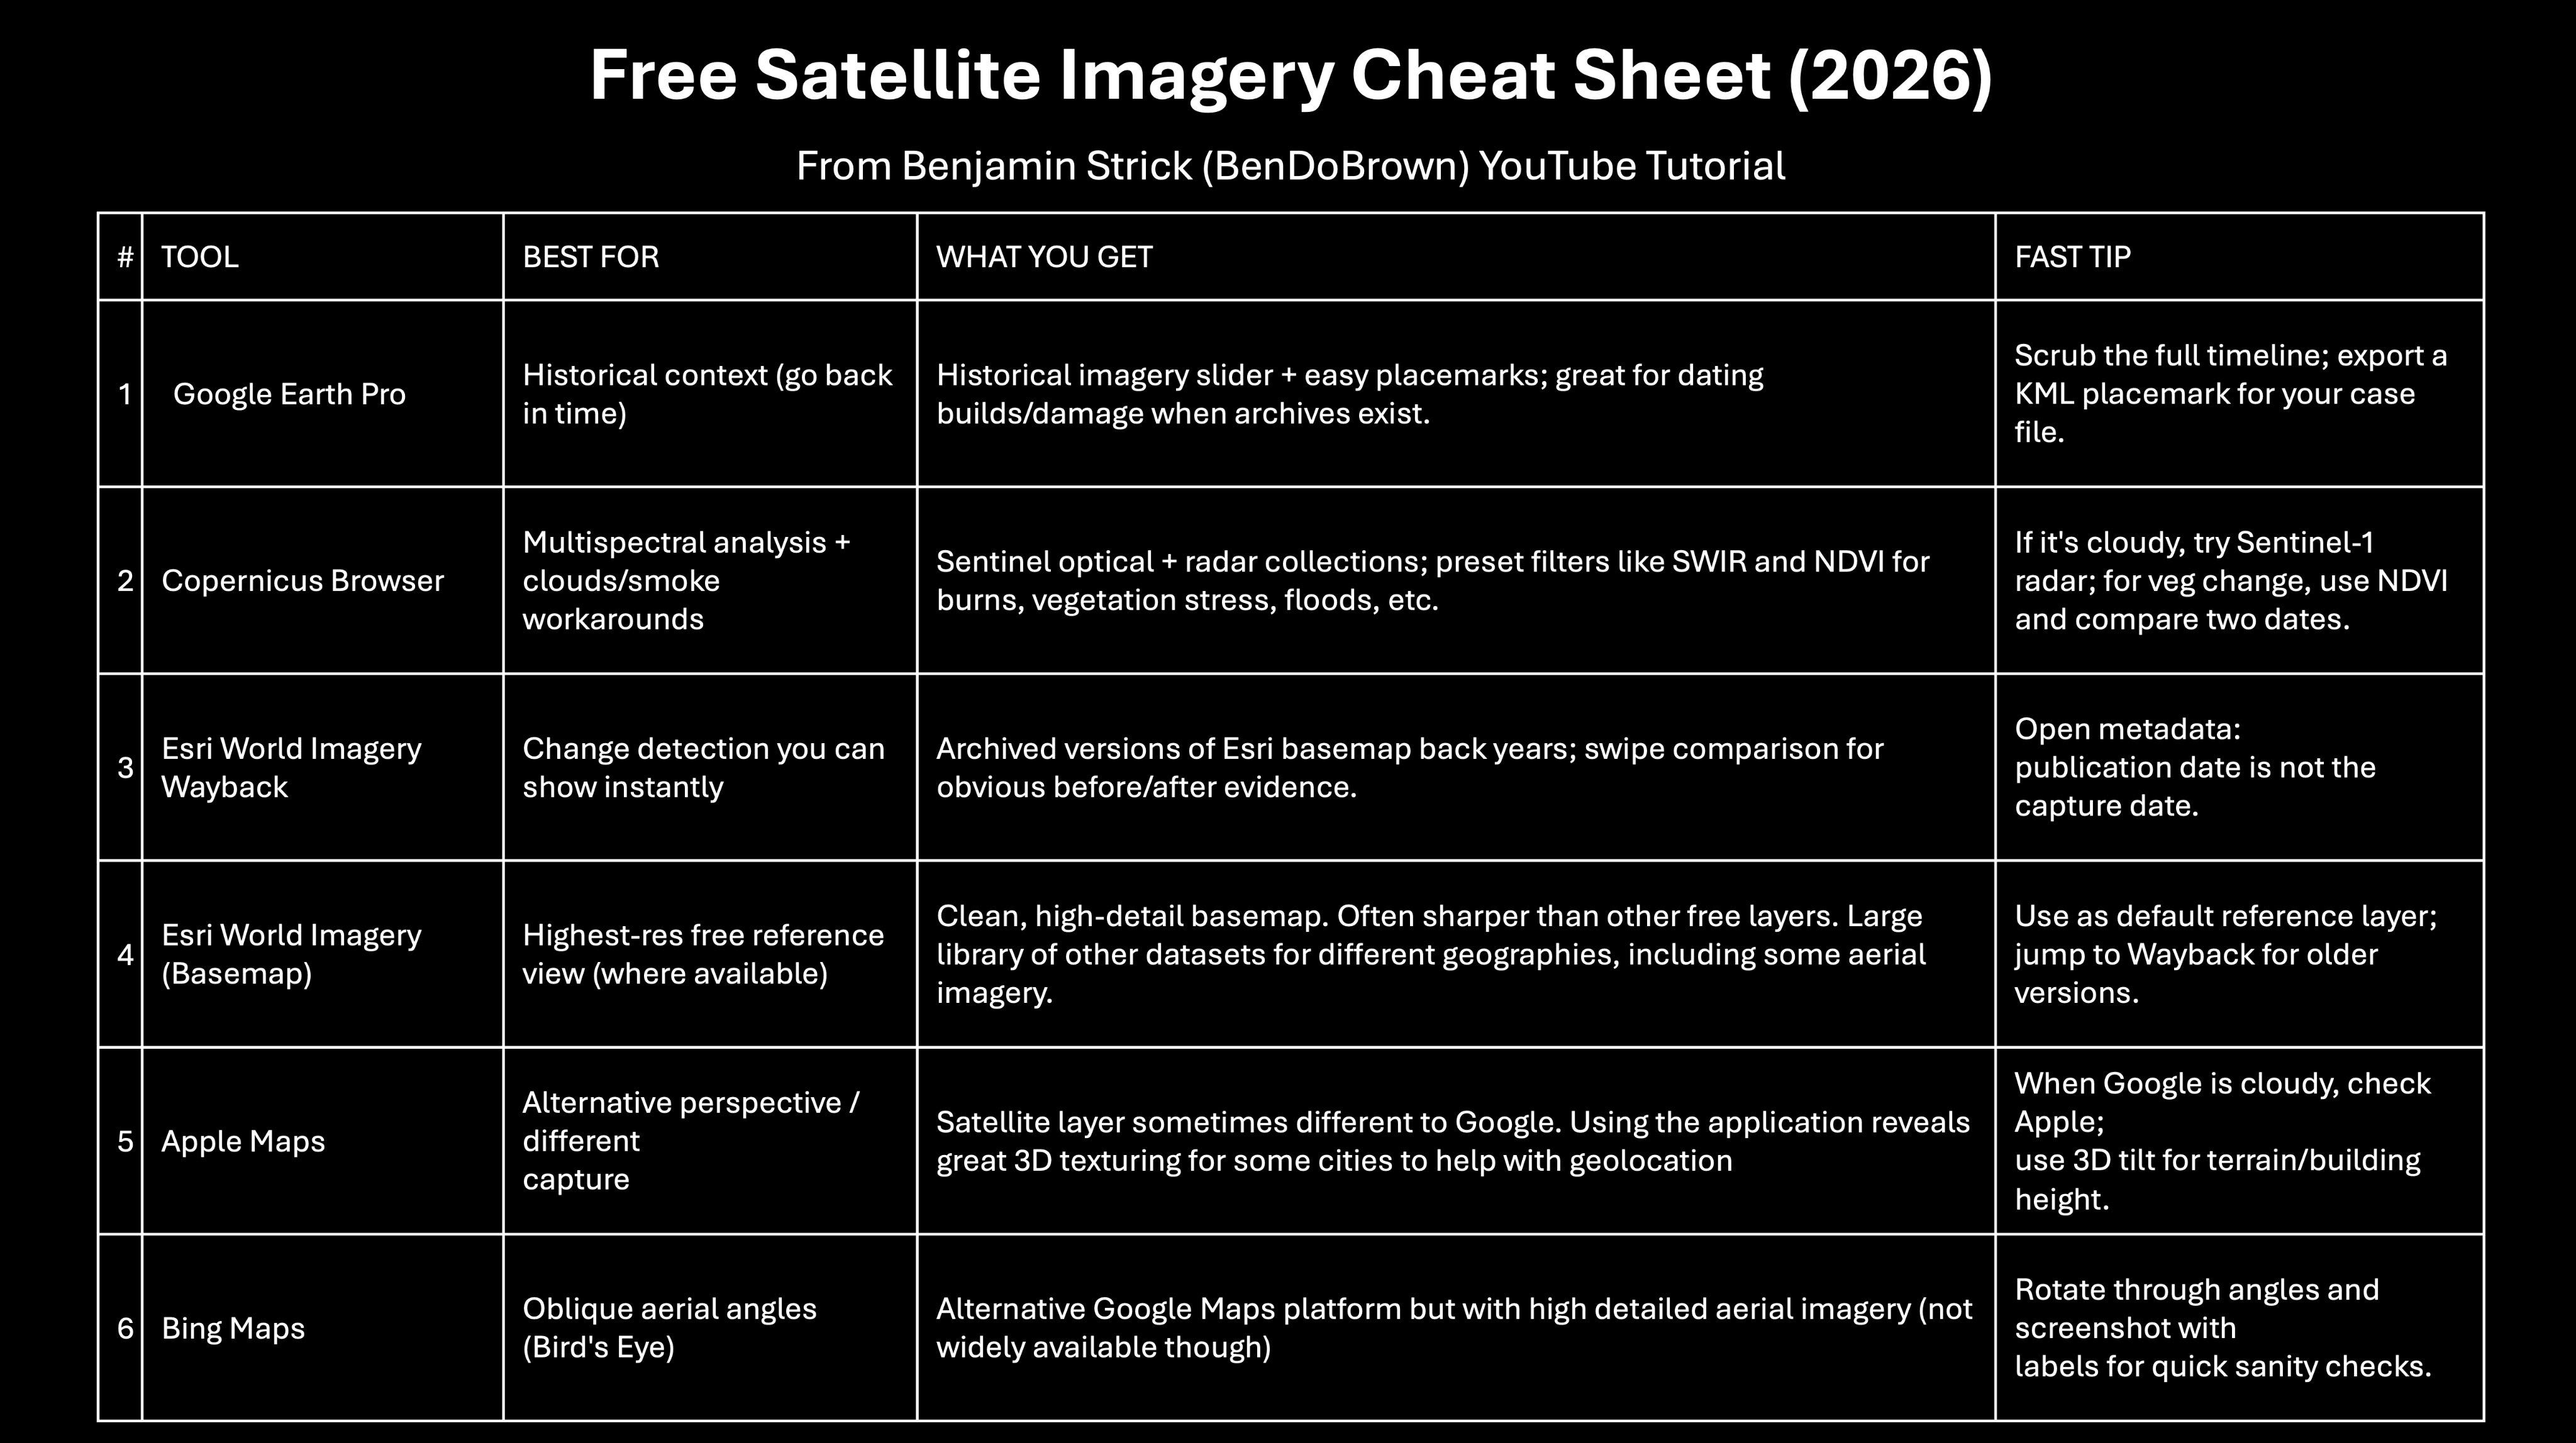
Google Earth Pro: The desktop workhorse for historical context, timeline sanity checks using the imagery slider, and annotating imagery. Good for baseline timelines, placemarking, and exporting KMLs.
Copernicus Browser: Web access to Sentinel-2 and other Copernicus data with band combos and time filtering. Good for seeing what RGB hides: burn scars, vegetation stress, water, smoke. Watch-out: Sentinel resolution is 10-20m optical. If it looks blurry, that’s the imagery. It’s confirmation and context, not fine detail.
Esri World Imagery Wayback: A “basemap history” tool for quick before/after checks. Good for fast hi-res swipe comparisons and “did it exist before X?” checks. Watch-out: The Wayback “release date” isn’t necessarily the capture date for your location. Treat it as a lead, not the answer.
ArcGIS Map Viewer: Free at a basic level in-browser, with a clean viewer and GIS layers for those in the Esri ecosystem. Watch-out: Like all basemaps, labels and update cadence can mislead if you don’t verify the source date.
Apple Maps: Sometimes surprisingly crisp in specific cities. Useful for cross-checking layout and 3D context. Watch-out: Apple doesn’t publish satellite capture timestamps. Cross-reference with other providers.
Bing Maps: Handy cross-check; in some places the aerial layer is better than you’d expect. Watch-out: Always treat it as one source in a stack.
Soar Atlas: Built for fast investigation workflows with filters, quick outputs, and GIF creation. Strong community with crowdsourced captures.
USGS EarthExplorer: The archive of record for dated scenes, especially Landsat. Good for pulling historical scenes with citable metadata. Watch-out: The interface is clunky, and it’s easy to download the wrong product level if you’re moving fast.
SkyFi: A buying and access layer for commercial imagery with clear entry pricing. Good for when you need recent hi-res and are willing to pay. Watch-out: Costs jump fast depending on resolution, archive vs tasking, and AOI size.
Google Earth Engine: Free for research/education/non-commercial use. Good for repeatable analysis at scale: time series, indices, change detection. Watch-out: It’s a compute platform, not a viewer. You need scripting discipline to avoid misleading outputs.
Spectator.Earth: Useful for browsing and ordering recent hi-res, plus tasking options. Watch-out: Tasking is a different beast to archive. Set expectations early on cost and timing.
NASA Worldview: Near real-time visualisation of a wide range of Earth observation layers. Good for rapid situational context (fires, smoke, dust) and first-pass timing cues. Watch-out: Not a replacement for hi-res evidence. It’s context and leads.
3. Technical Teardown: Stacking satellite sources for a defensible timeline
Any single satellite platform gives you a picture. Stacking multiple sources gives you evidence. The goal is to turn a finding (”something changed here”) into a defensible timeline with layered evidence: high-level history, sensor-confirmed change signals, and crisp visual before/after. In the example below, we’re going to walk through this using the example of change identified in 2023 in Khartoum International Airport.
Step 1: Start with the claim, not the tool
Write one sentence: WHAT changed, WHERE, and roughly WHEN? If you can’t express it in one sentence, you’re about to chase shiny imagery instead of evidence.
In this case, planes and buildings were destroyed on the tarmac in Sudan’s Khartoum around April 2023.
Step 2: Google Earth Pro for the rough timeline
Search the location and turn on historical imagery. Before scrubbing the timeline, zoom to a level where the feature of interest is clearly visible. Make sure you look at the imagery when zoomed out and in, to make sure you’re understanding the full geographic context of that day, as well as the micro details. Scrub until the feature appears or disappears. Note the earliest “definitely present” and latest “definitely absent” dates.


Step 3: Copernicus Browser to confirm change signals
Go to the same AOI. Pull Sentinel-2 L2A if available. Check true colour first, then one “purpose” view: SWIR composites for burn/scar detection, NDVI for vegetation change, or false-colour for water/soil disruption. Use the time filter across your Google Earth window to see if the signal matches the story.
If your target dates are cloudy in true colour, try Sentinel-1 SAR (radar). It sees through cloud and can confirm structural changes when optical is useless. Especially relevant for tropical or monsoon-season investigations.


Step 4: Esri Wayback for the clean hi-res before/after
Jump to the AOI. Tick “only versions with local changes” (when available) to avoid noise. Find the closest “before” and “after” releases that bracket your Copernicus-confirmed window. Use swipe/compare exports for a clean visual.


Step 5: Document your sourcing
For each screenshot or export you keep, record:
Tool name and version (e.g. Google Earth Pro)
Layer or product (e.g. Sentinel-2 L2A, True Colour)
Date displayed in the interface
Actual capture date if available (check metadata)
What you claim this image shows
What it does NOT prove (state limitations explicitly)
If the tool doesn’t expose the capture date, say so. Label the image as “supporting context” rather than “evidence”.
I’ve linked to my post on X where I give a further visual as to how you could ‘stack’ the different platforms.


4. Case File: The U.S. tech powering Russia’s drone war
Hunterbrook Media’s investigation into Ubiquiti is worth your time, not just for the impact and accountability investigation, but also for the methods.
They traced how affordable American radio bridge antennae became essential kit for Russian military communications in Ukraine, including drone operations that the UN has called crimes against humanity, mapping the intermediaries, shell companies, and transshipment routes that kept the equipment flowing despite sanctions
I’d strongly recommend reading the full piece. What follows is a methods summary, not a substitute for the original reporting.

What they found
Ubiquiti, a $34 billion American tech company, makes affordable radio bridge antennae that have become key infrastructure for Russian military communications in Ukraine, including drone operations. Despite U.S. sanctions and export controls, the equipment continues to flow into Russia through intermediaries, official distributors, and shell companies.
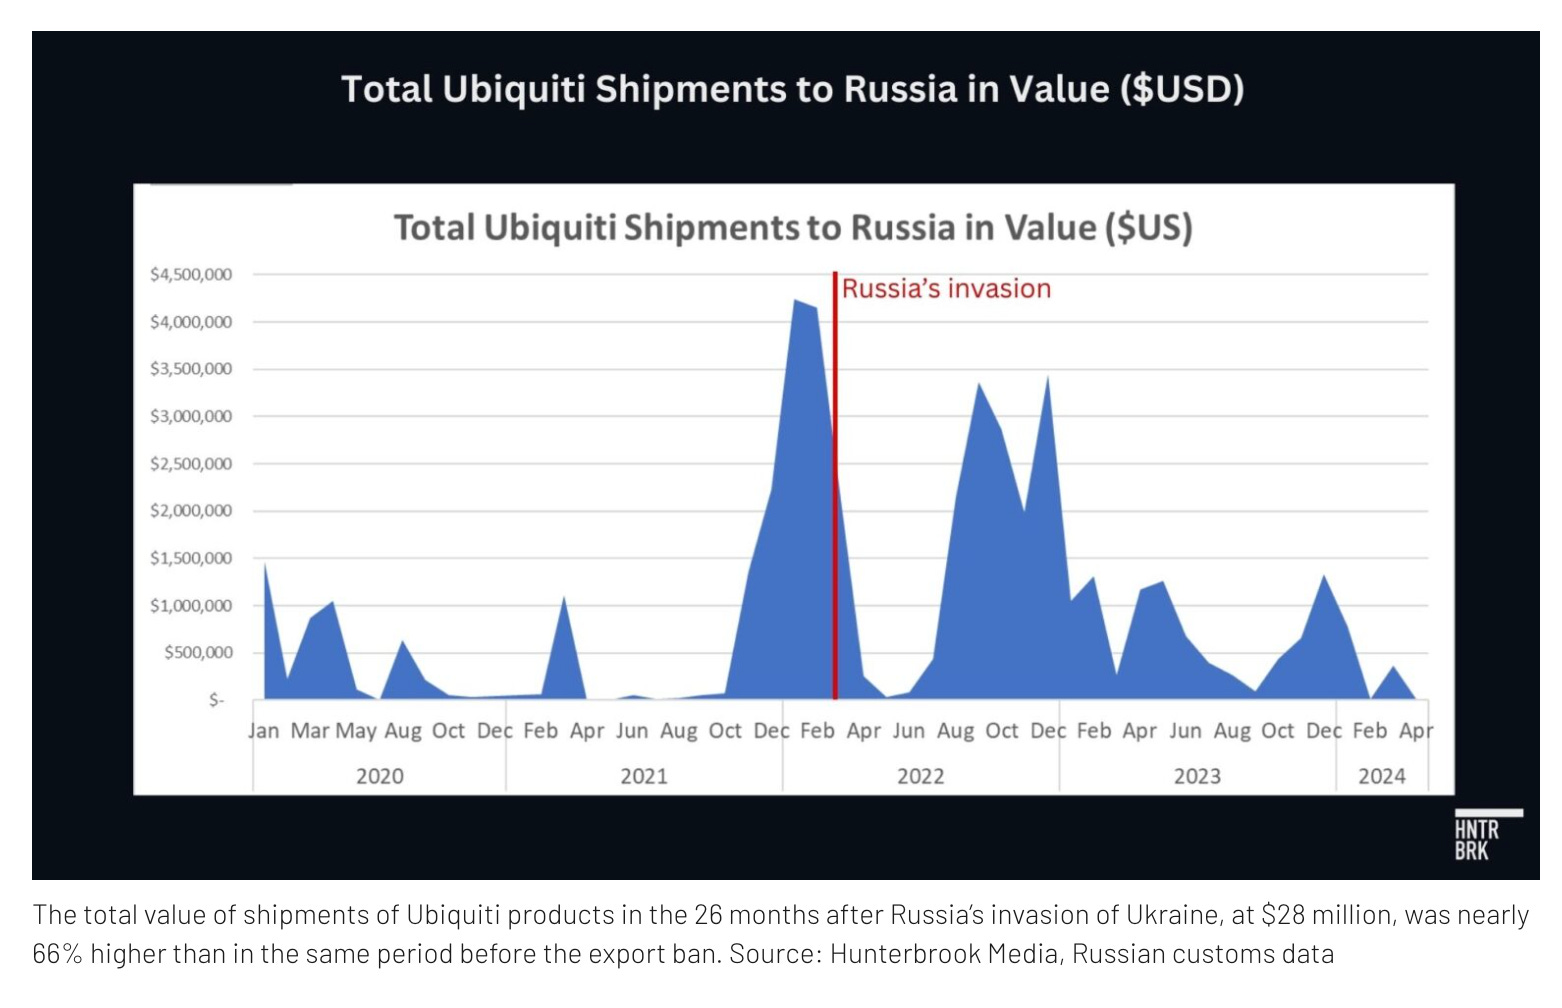
A Ukrainian communications officer estimated roughly 80% of Russian radio bridges observed on the front line are Ubiquiti products. After direct shipments appeared to halt in late 2022, dozens of third-party intermediaries filled the gap. The total value of Ubiquiti shipments into Russia rose 66% post-invasion, with new export corridors appearing from Turkey, Kazakhstan, the UAE, Hong Kong, and Kyrgyzstan only after the ban.
Undercover procurement testing confirmed availability: nearly a dozen vendors, including official Ubiquiti distributors, promised delivery to Russian-controlled territory. At least 10 intermediaries identified in the trade data were later sanctioned for export control evasions.


The methods (and where to start if you’re investigating similar supply chains)
The investigation is a good example of layering different OSINT techniques to trace dual-use technology from manufacturer to battlefield.
The core pattern is worth noting:
find the battlefield use
map the supply chain backwards
test whether you can still buy the kit
trace the transshipment routes.
That sequence works across sanctions-evasion investigations. Here are some of the tools and approaches that support this kind of research:
Trade data analysis: Platforms like ImportGenius and Panjiva can surface customs records showing shifts in shipping patterns, new intermediaries, and mismatches between declared origins and loading locations.
Telegram monitoring: Tools like TGStat, OpenMeasures, and Telepathy can help monitor fundraising groups and military-affiliated channels for mentions of specific brands, model numbers, or procurement activity.
Corporate registry research: Localised registries (in this case kompra.kz and Kazakhstan’s business registry) alongside tools like OpenCorporates, the Russian Federal Tax Service, Clearspending.ru, and the Internet Archive can help identify shell companies through address matching (Simple Solutions and Wireless Communications registered at the same address in Kazakhstan), shared registration details (identical contact emails, founders, phone numbers), and domain analysis (connecting multiple storefronts to the same operator through domain registration records).
Network visualisation: Tools like Maltego, Neo4j and Gephi can map entity relationships (manufacturer, distributor, re-exporter, vendor, military) and distinguish confirmed flows from suspected ones.
None of these tools on their own prove anything, but stacked together they’re how you build something that holds up.
Closing Note
What struck me putting this edition together is that none of the best work I’ve seen relies on one clever trick.
The Hunterbrook investigation didn’t crack the Ubiquiti supply chain with a single move. They layered trade data with Telegram monitoring, corporate registries, undercover procurement, and network mapping until the story was airtight. The satellite workflow in this edition’s teardown follows the same logic: no single platform gives you evidence, but three sources triangulated give you a timeline you can stand behind.
You don’t need the most expensive tool or the most classified source. You need the patience to look at a problem from three or four angles and stitch the evidence together until it tells a story someone can’t wave away. That’s true whether you’re tracing sanctions evasion or documenting what happened to an airfield in Khartoum.
If you found this useful, forward it to a colleague. It helps more than you’d think.
Until next time, Ben.
Do remember while you're tracking "sanction-busting" ships that sanctions - unless established by the United Nations Security Council or General Assembly - are ILLEGAL under international law.
So who's violating what?