
OSINT Field Notes #6
Satellite imagery, strike denial, a 1,431-page influence leak, and the feline facial recognition that gave away a money launderer.
Welcome to edition six of OSINT Field Notes.
The Iran conflict has produced a volume of verifiable material that would have been unthinkable a decade ago: satellite imagery, geolocated videos, munitions analysis, strike timelines. With it came a serious test of whether open-source verification can substitute for the extremely limited on-ground access. One case in particular, a school in Minab, saw several independent organisations work from the same Planet Labs imagery and arrive at the same conclusion.
That satellite imagery saw stress-testing in the industry as well, with Planet Labs later introducing a 14-day delay to all new imagery in the Middle East.
It was also only a few weeks ago that a 1,431-page leak gave researchers an unusually granular look inside Russia’s foreign influence machinery: budgets, named operators, and country-by-country tactics. The Case File in this edition goes into the detail on that.
I also published a tutorial this month on geolocating a Taliban strike in the Afghan desert, one of the harder geolocation problems, with no fixed infrastructure to anchor to. The method is in the Dispatches section below.
The Technical Teardown covers the Dark Light Viewer, a free browser tool I built for tracking infrastructure change using NASA night-light data. A reminder that when some sources dry up, getting creative with under-utilised sources can open up new avenues for research.
Ben.
1. DISPATCHES
Special Dispatch: Satellite Accountability and the Minab School Strike
On 28 February, the Shajareh Tayyebeh primary school in Minab, southern Iran, was destroyed in a strike that killed at least 168 people, most of them children. The casualty count remains unconfirmed.
No government claimed responsibility. Into that denial, several organisations independently deployed satellite imagery and open-source verification and arrived at the same conclusion.
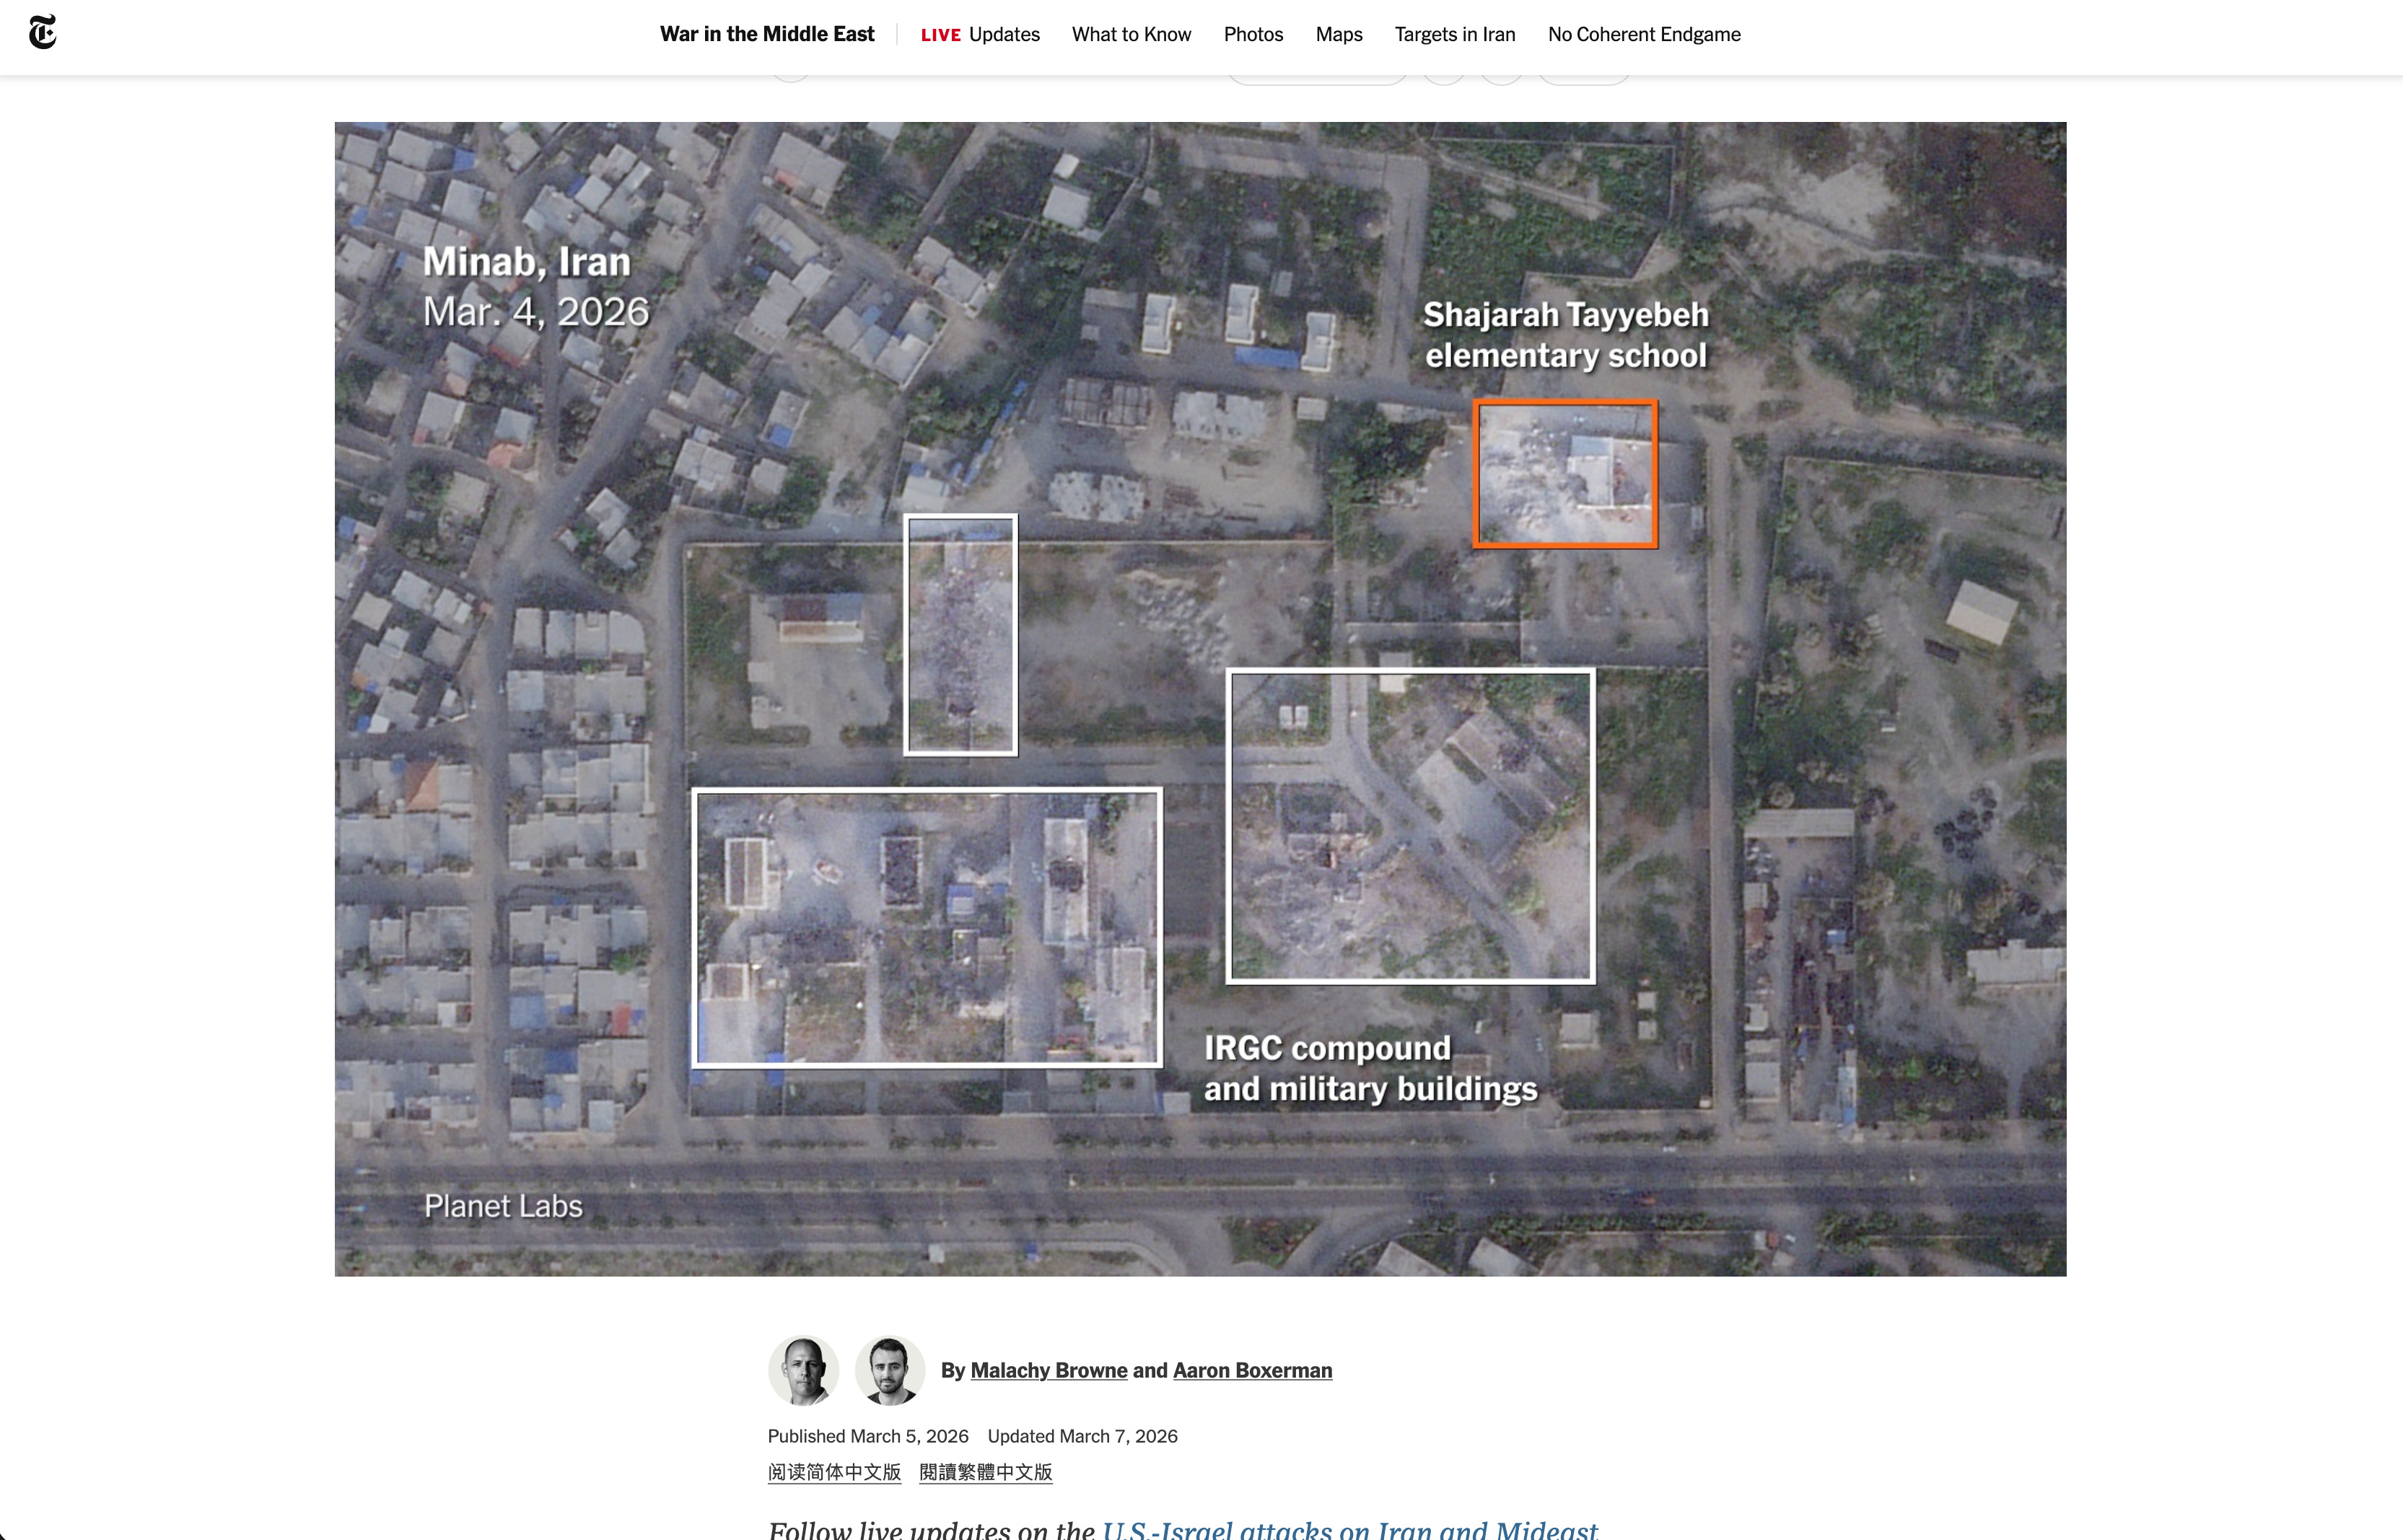
NYT Visual Investigations, BBC Verify, Channel 4 FactCheck, CBC News, and Human Rights Watch all worked from the same Planet Labs imagery. All found the same pattern: precision strikes on multiple structures across the IRGC naval compound, including the school. All confirmed via historical satellite record that the school had been walled off from the military compound since 2016.
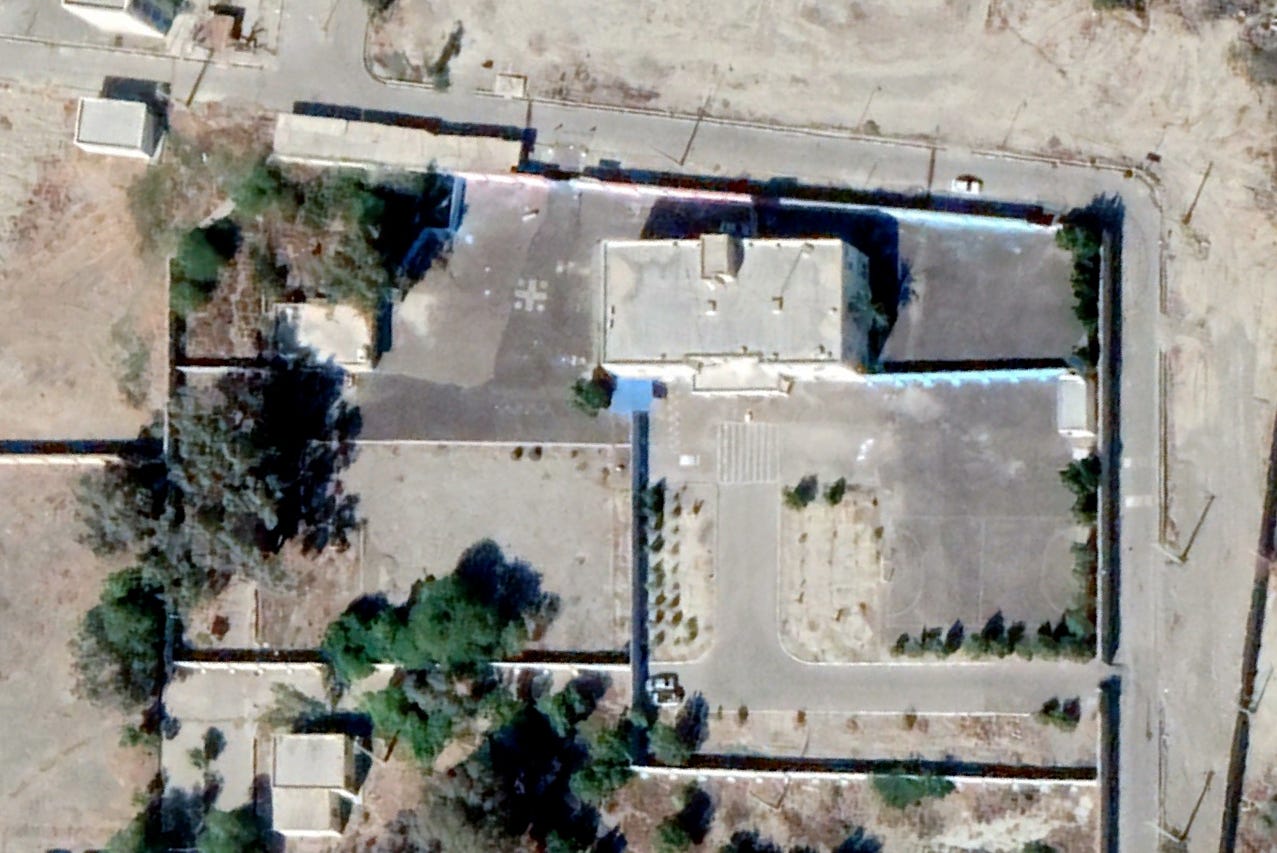
Since 2016, imagery shows the building has its own perimeter, its own entrance, a sports pitch, colourful walls and drawings on the ground - as seen in the angled imagery below that I collected from Google Earth (2018).
Munitions experts consulted independently by BBC Verify, Channel 4, and CBC assessed the strike pattern as consistent with guided munitions hitting deliberate targets, not errant weapons. Reuters reported separately that the US military’s internal investigation was pointing toward likely US responsibility. HRW formally called for the attack to be investigated as a war crime on 7 March.
The methodology across all of them: satellite tasking, historical imagery comparison, video geolocation, munitions analysis, was consistent, reproducible, and built entirely from open sources. BBC Verify also debunked prominent claims circulating online: that a misfired Iranian missile caused the damage. The image used to support that narrative was traced to an unrelated incident in Zanjan, over a thousand kilometres from Minab.
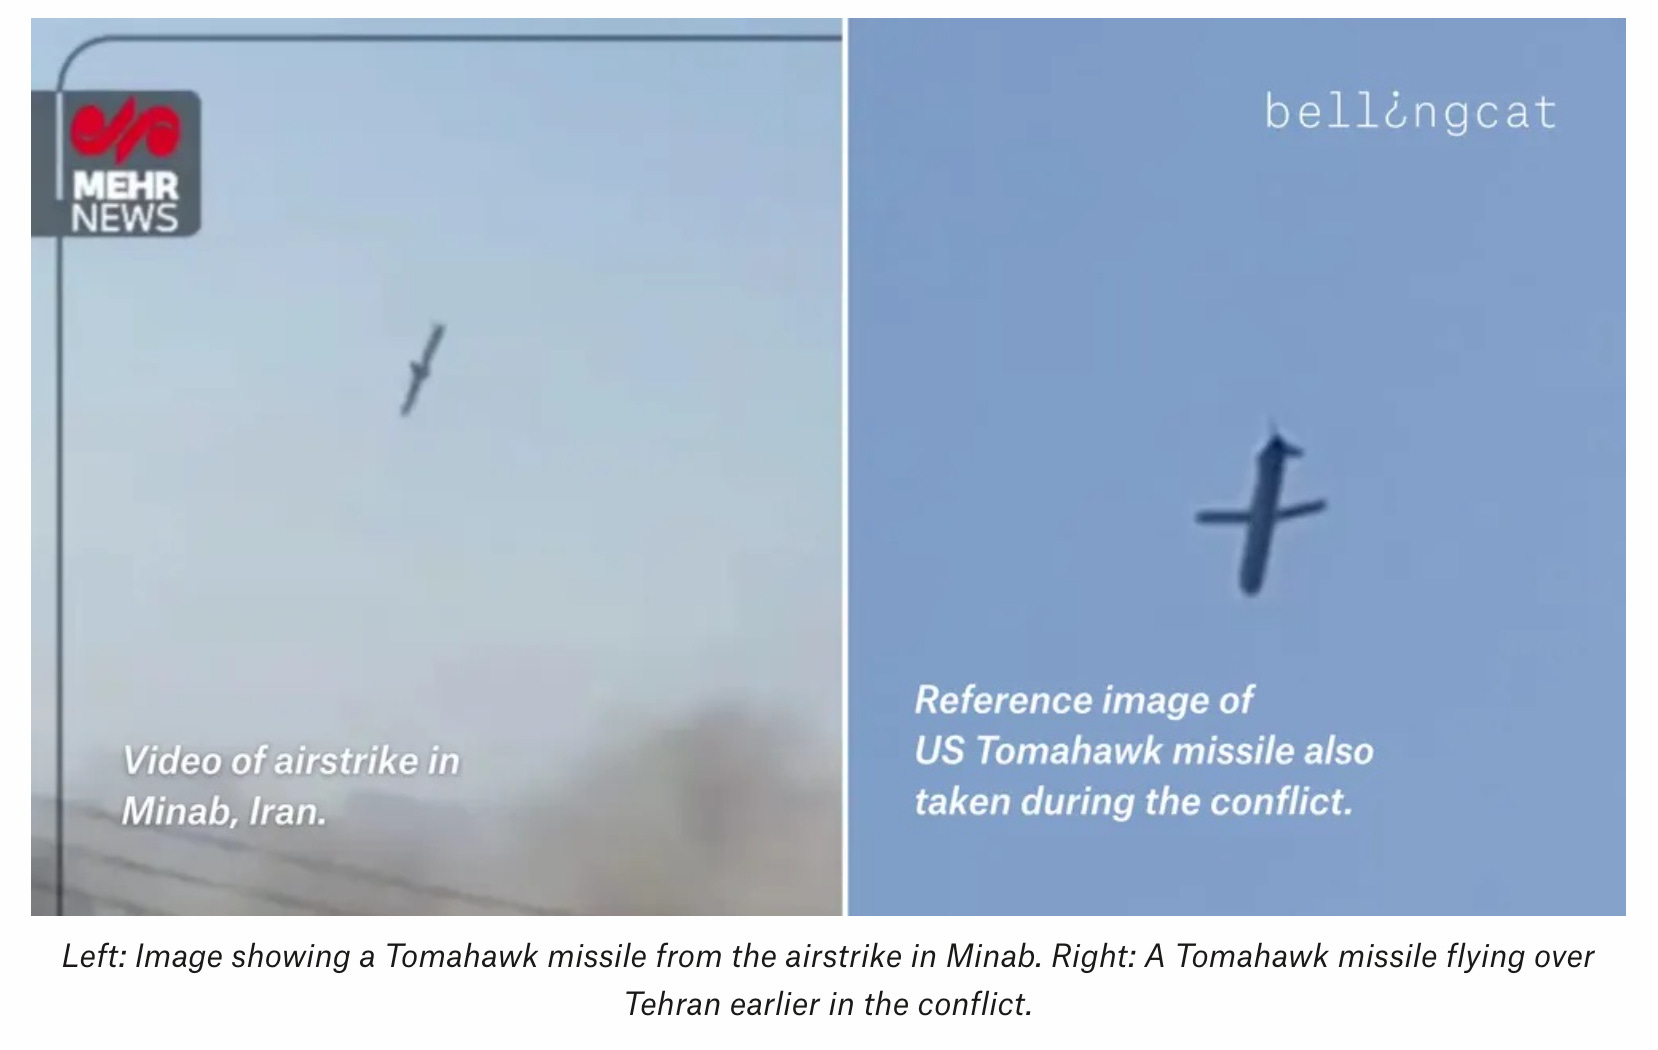
A further update to the investigation was published by Bellingcat, which had analysed footage released after the strike, which reportedly showed a US Tomahawk missile striking the base near the school. The footage was independently analysed by New York Times, CNN and others, adding to the body of evidence. More information was analysed by New York Times, looking at fragments of the missile purporting to be from the strike. Again showing that detailed OSINT analysis takes time, not only due to the work, but also the availability of material.
The takeaway here is the independent teams, same satellite data, consistent findings. When states deny and access is blocked, multiple independent verification workflows are themselves a form of accountability.
A further insight into the work taken to validate findings for these newsrooms was included in a response to criticisms about headlines. See the tweet below for more of that detail on the efforts taken behind the scenes to produce the findings from the New York Times.

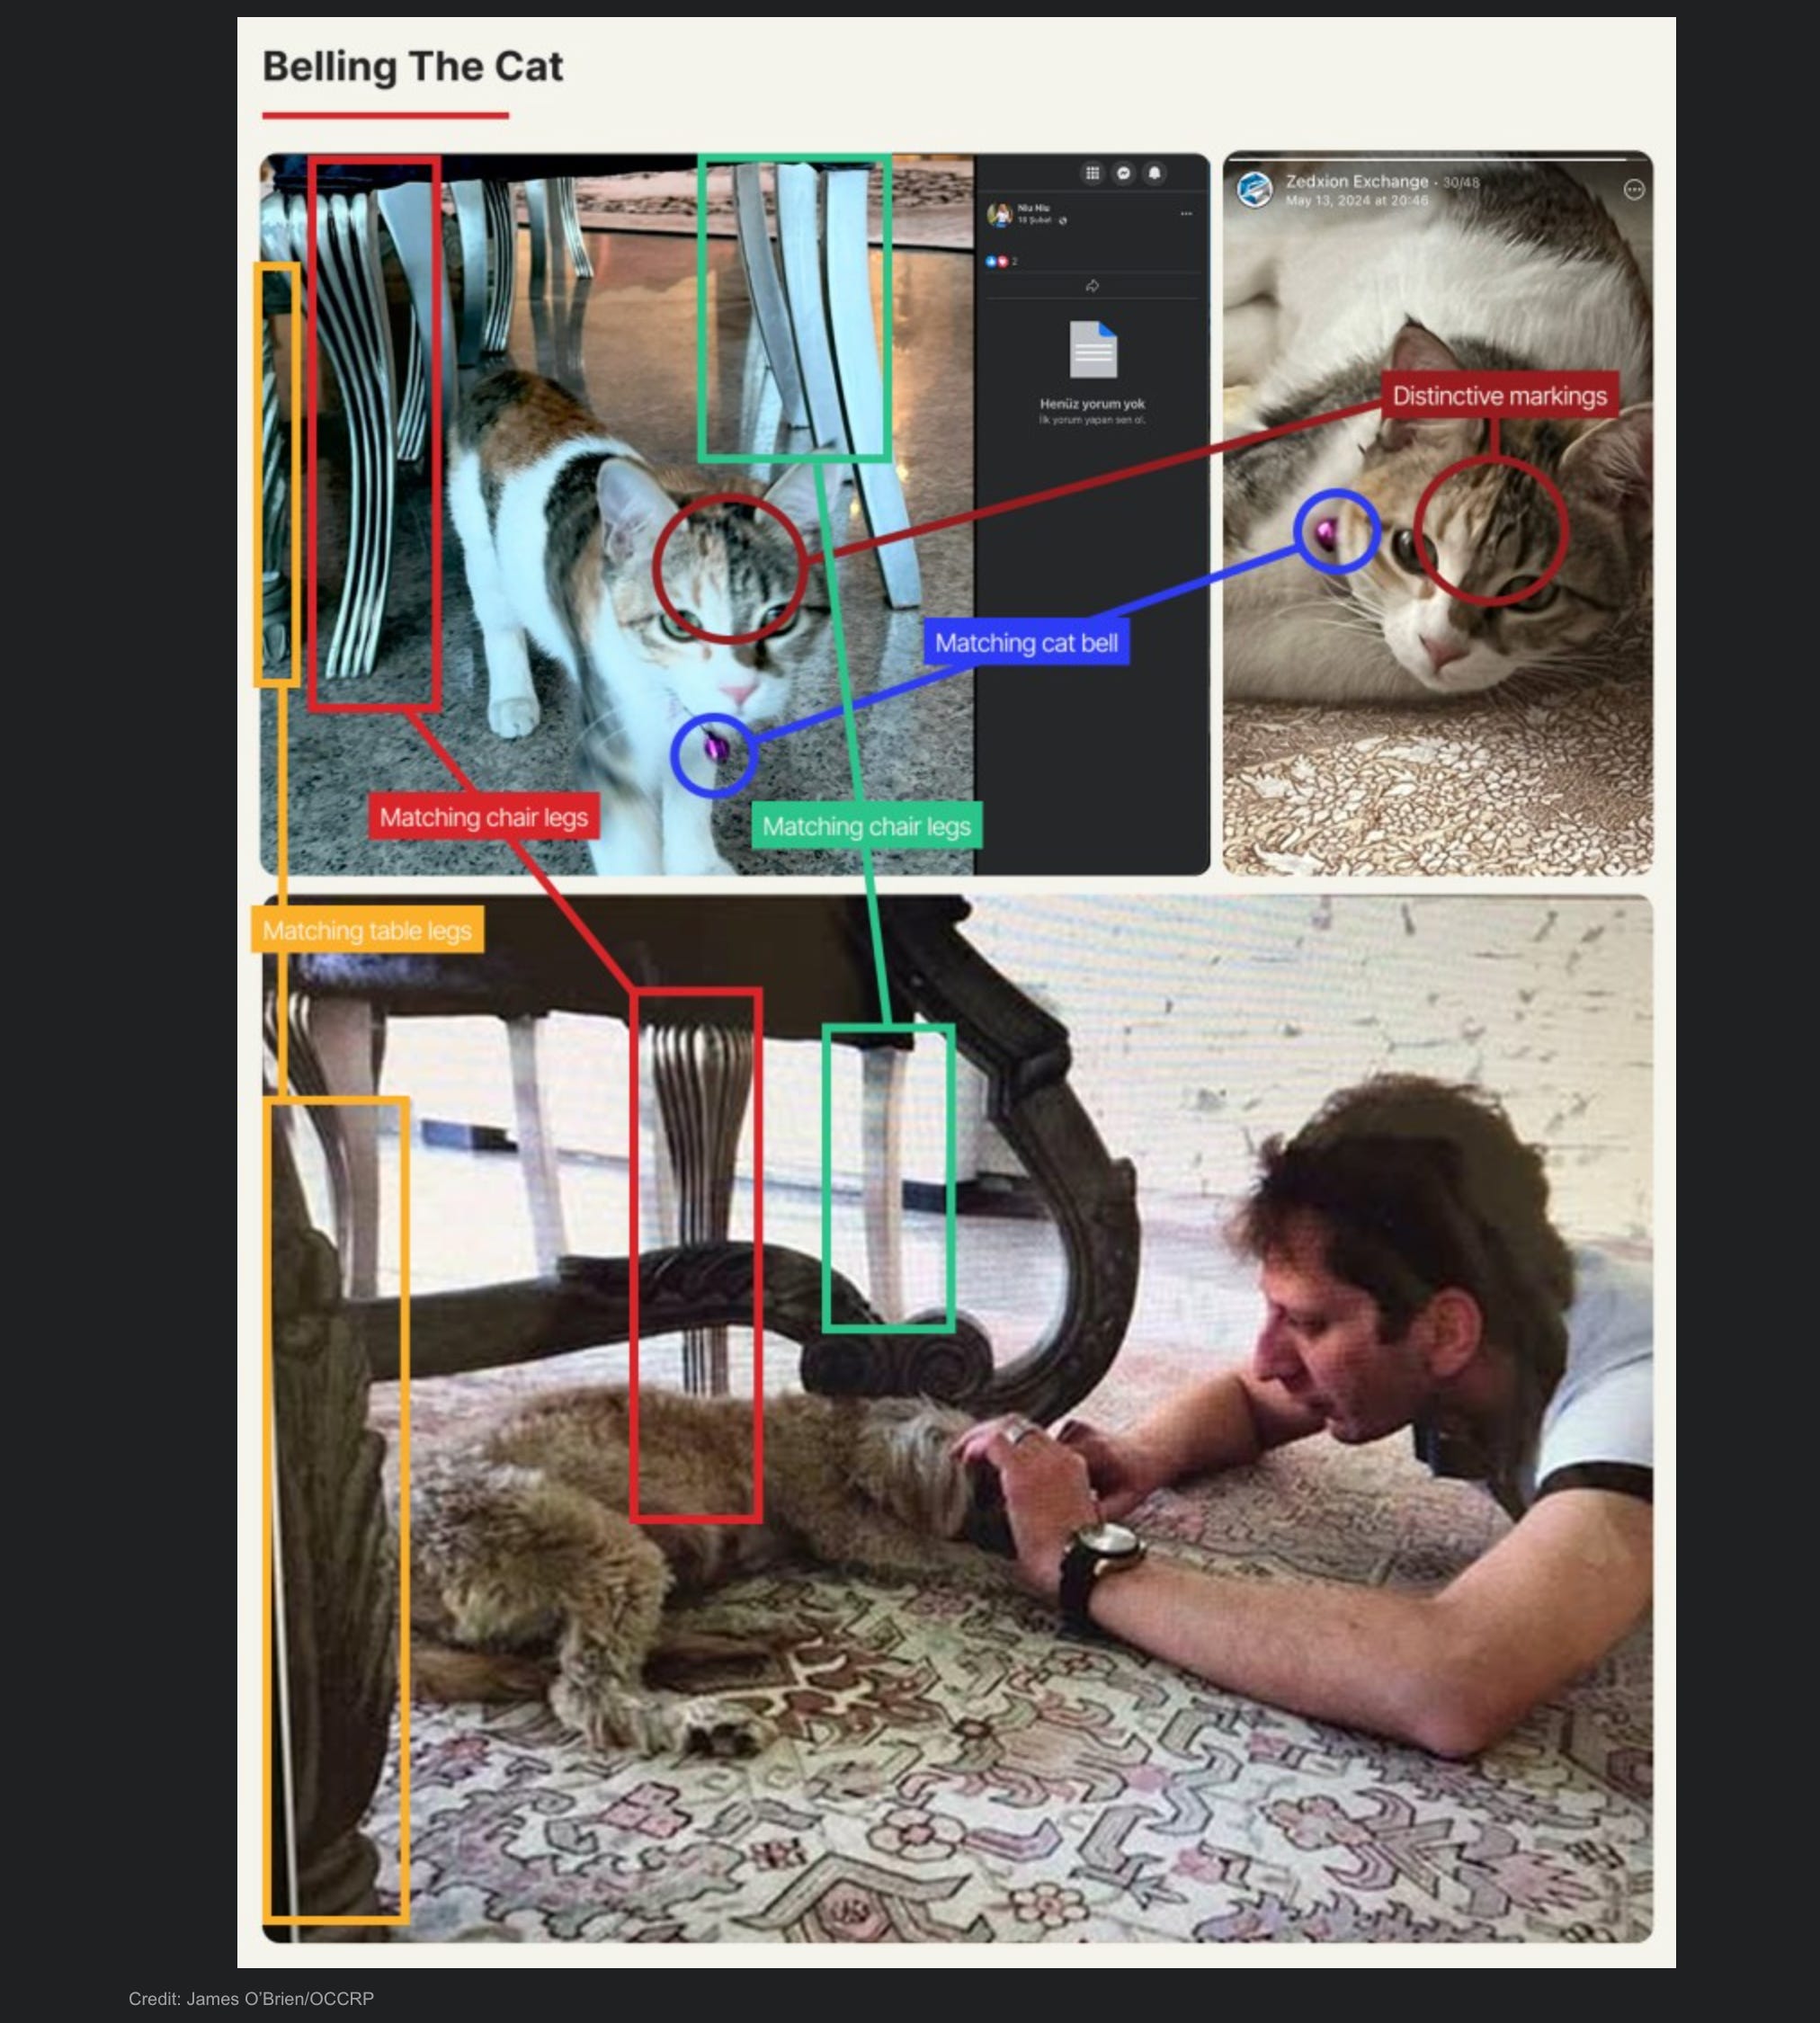
The Stock-Footage CEO: Unravelling Iran’s Crypto Money Machine
OCCRP’s reporting on Elizabeth Newman is a clean example of why corporate registry work still matters. Newman appeared to be the head of two UK-registered crypto exchanges moving extraordinary volumes. But the face in the promotional video matched stock footage, and the listed addresses led to locations that did not fit the scale or nature of the business.
From there, the reporting moved the way good registry work should: cross-referencing company filings, sanctions material, associated entities, and the people orbiting the structure. The result was a much clearer picture of how a supposedly respectable UK corporate front could be used to mask a sanctions-linked money-moving operation.
Also, this is the first time I’ve seen feline facial matching.
Geolocating a Taliban Strike in the Kandahar Desert
Starting from a Taliban propaganda video, this geolocation investigation and tutorial video I made walks through a complete geo-profiling workflow for one of the harder geolocation problems: finding an exact sand dune in open desert with no infrastructure to anchor to. The method sequences easier fixes first, identifying Kandahar Airfield, tracking flights into empty terrain, pinpointing a soldier drop-off point, then uses that timeline to constrain where the dune strike could have occurred. The final result is an exact location, verified against dune formations visible in the source footage.
The key takeaway here is when a single frame resists geolocation, build a timeline from the frames that don’t. Each confirmed fix narrows the search area for the ones that do, a technique that transfers directly to any multi-source desert or featureless-terrain investigation.
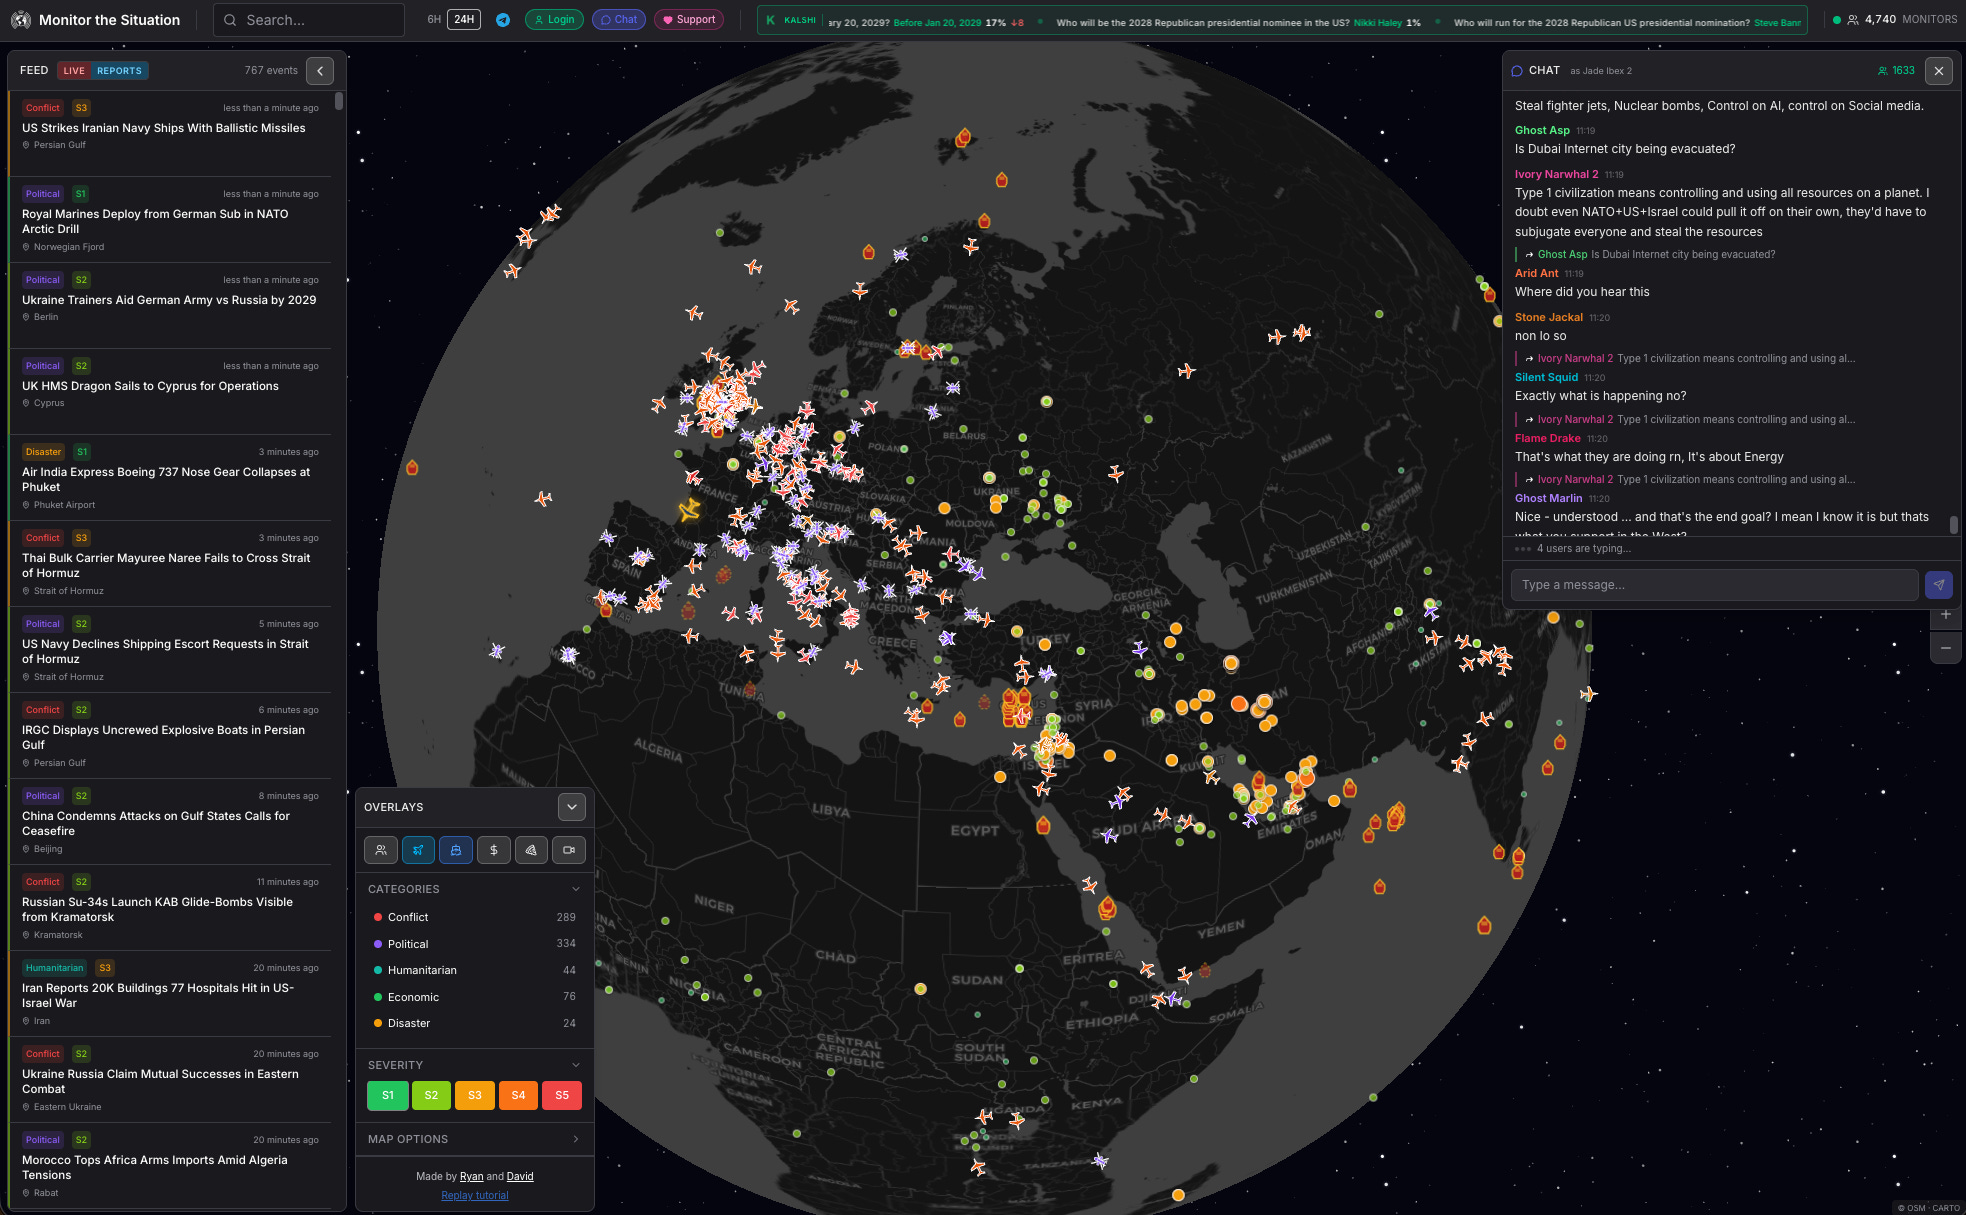
Situational Awareness Dashboards Are Everywhere Now
A new category of tool has quietly taken hold: consolidated monitoring dashboards pulling live conflict feeds, incident reports, and open-source alerts into a single interface. WarTracker24, WorldMonitor, Signal Cockpit, Monitor the Situation, the list keeps growing. The newsletter OSINT Jobs has dug into these, looking at how these dashboards can work and what situational awareness actually takes.
They can be useful, but they can also be genuinely overwhelming. When a fast-moving situation breaks, these maps light up. Events stack. Pins multiply. The volume of incoming information can exceed any analyst’s ability to process it in real time, which creates its own kind of blindness.
That’s where the investigator’s job actually starts, not consuming these dashboards, but using it as a launchpad. Drilling into a location. Pulling the thread on a linked event. Cross-referencing what the map shows against what primary sources confirm and making real findings, trends and patterns.
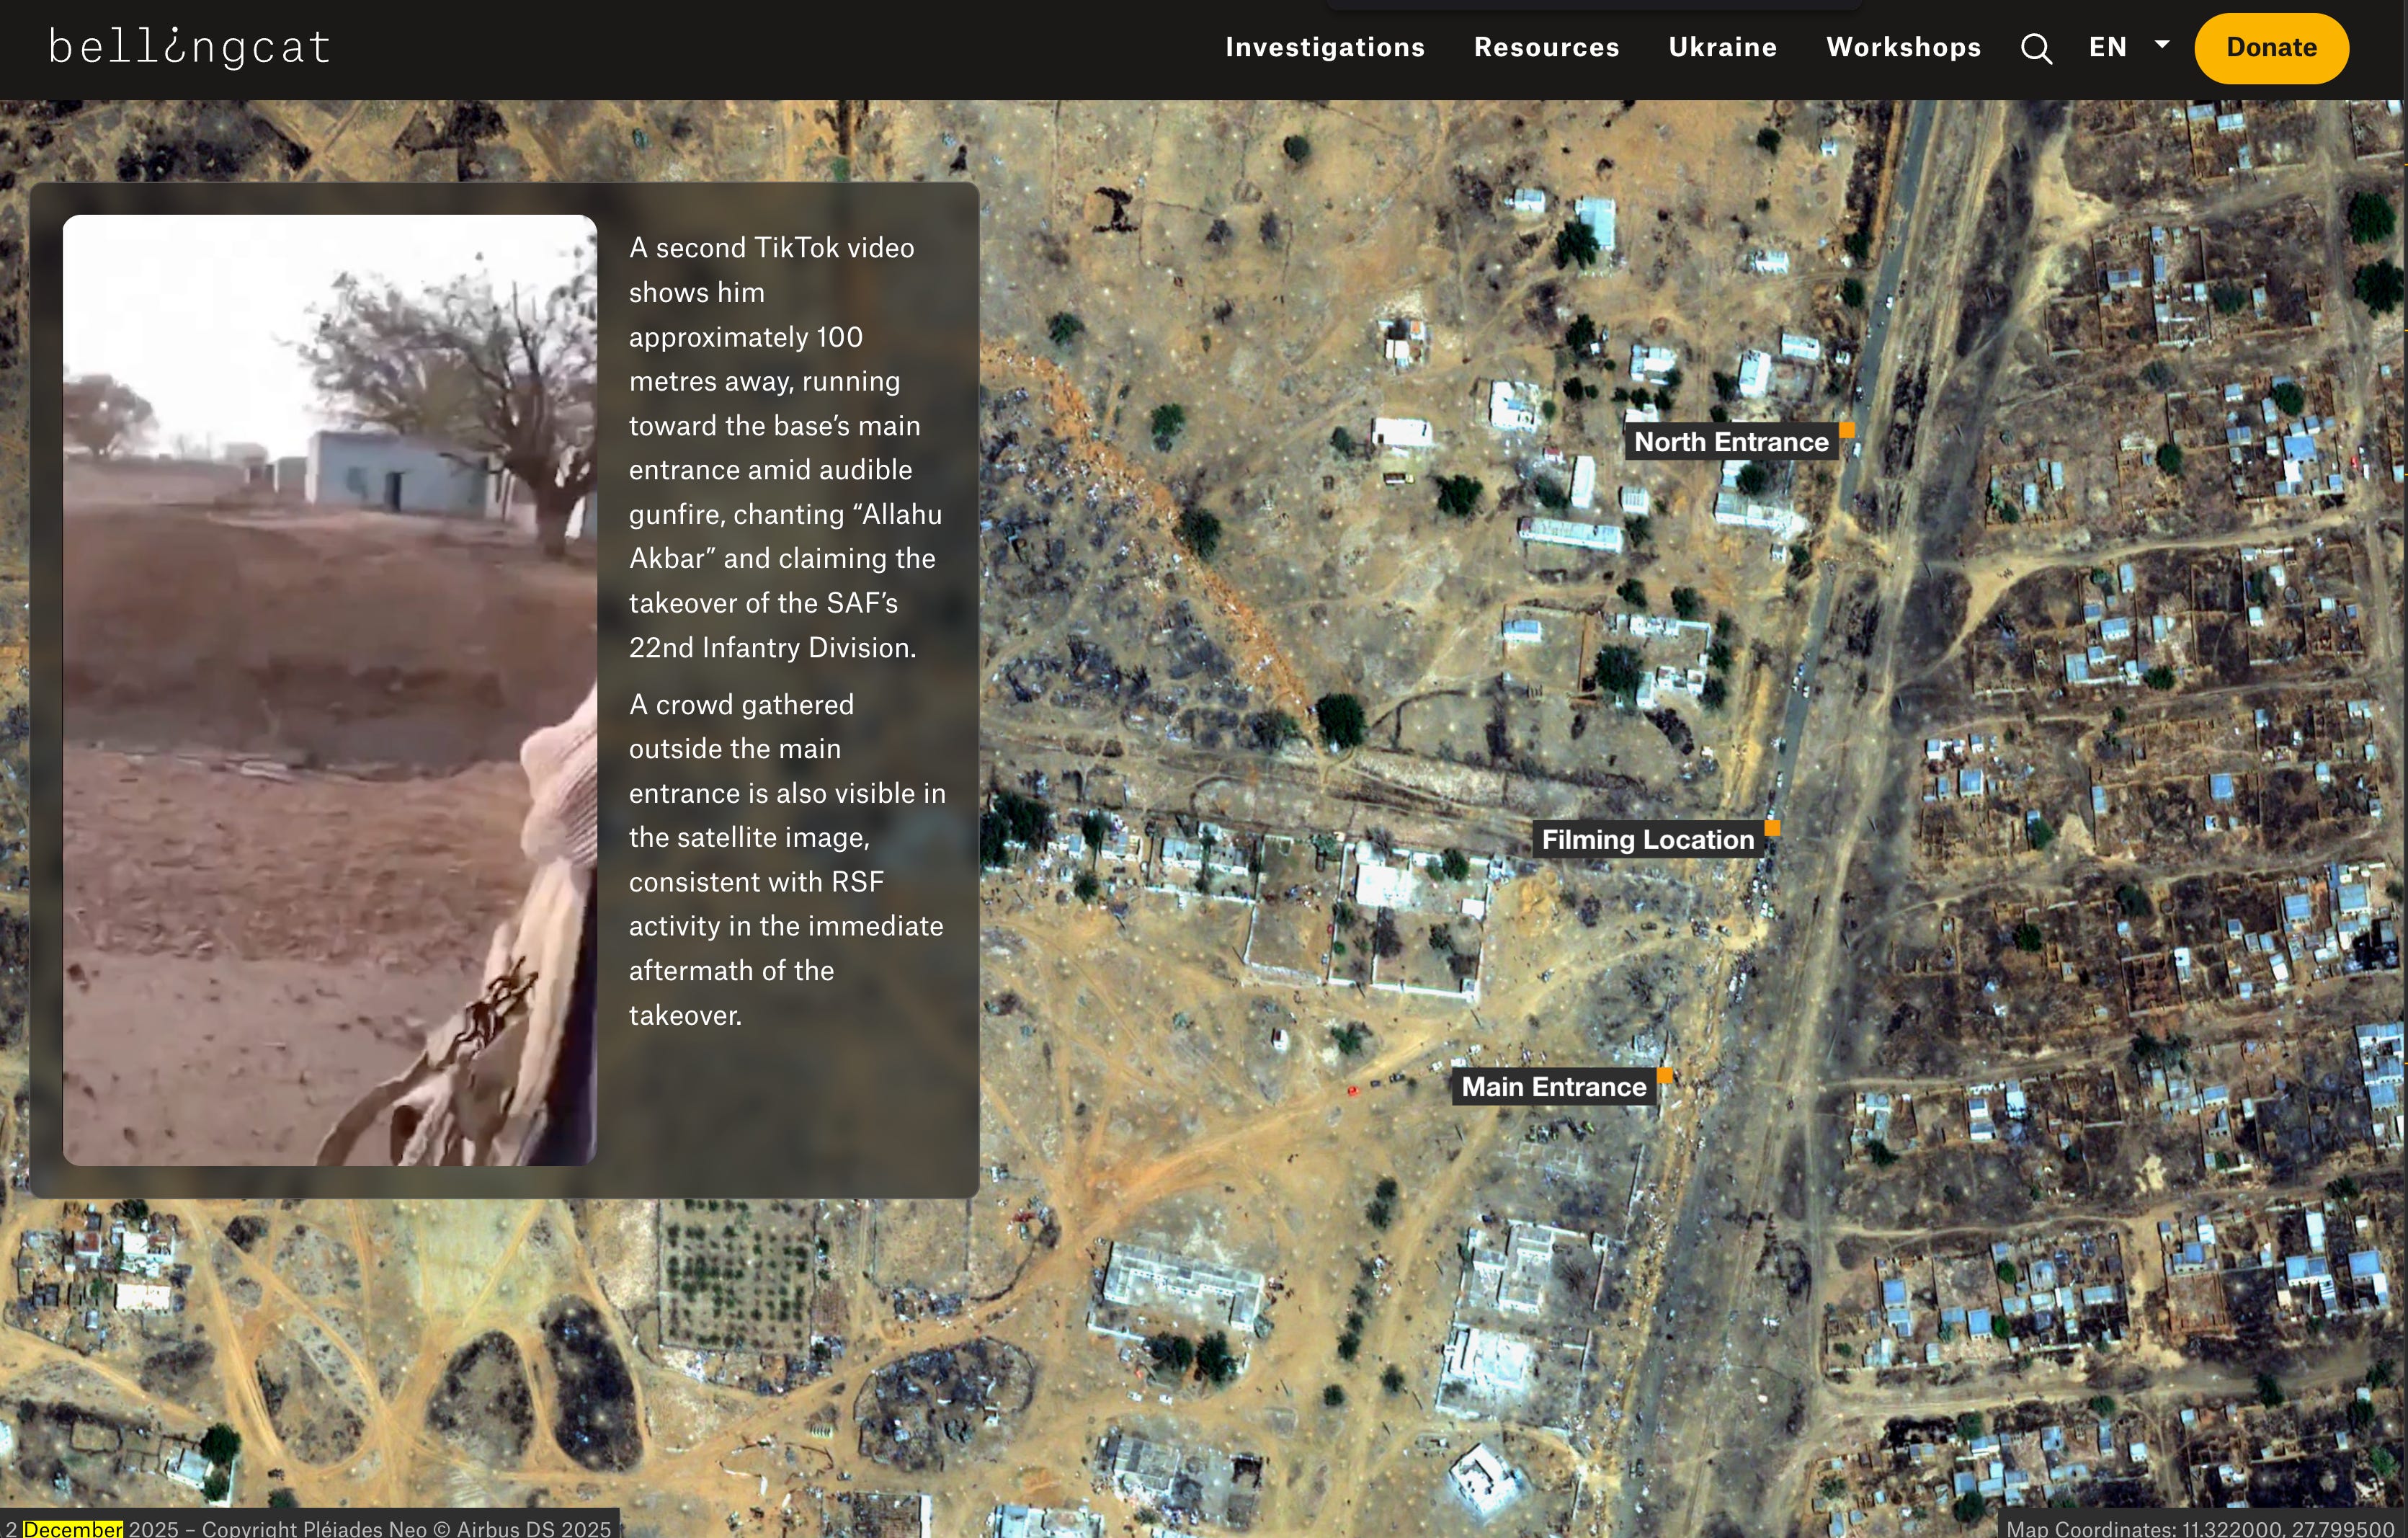
Lion Cubs of Sudan: TikTok, Child Soldiers, and the Algorithm
Bellingcat’s investigation into child soldier content from Sudan’s civil war is disturbing, but methodologically sharp. It shows how battlefield participation is being repackaged through TikTok aesthetics, viral audio, and influencer-style framing, turning children in combat roles into algorithmic content.
The strongest part of the piece is the link between platform content and verifiable reality on the ground. December 2025 satellite imagery was used to corroborate a mass casualty scene seen in one child’s footage, while repeated audio use across hundreds of clips pointed to coordinated amplification rather than purely organic spread.
One of the great techniques exhibited here is that when satellite imagery can anchor a scene from social video to a real place and timeframe, it turns a clip into evidence with far more investigative value.
Russia’s Propaganda Architecture: The Leak That Changed the Picture
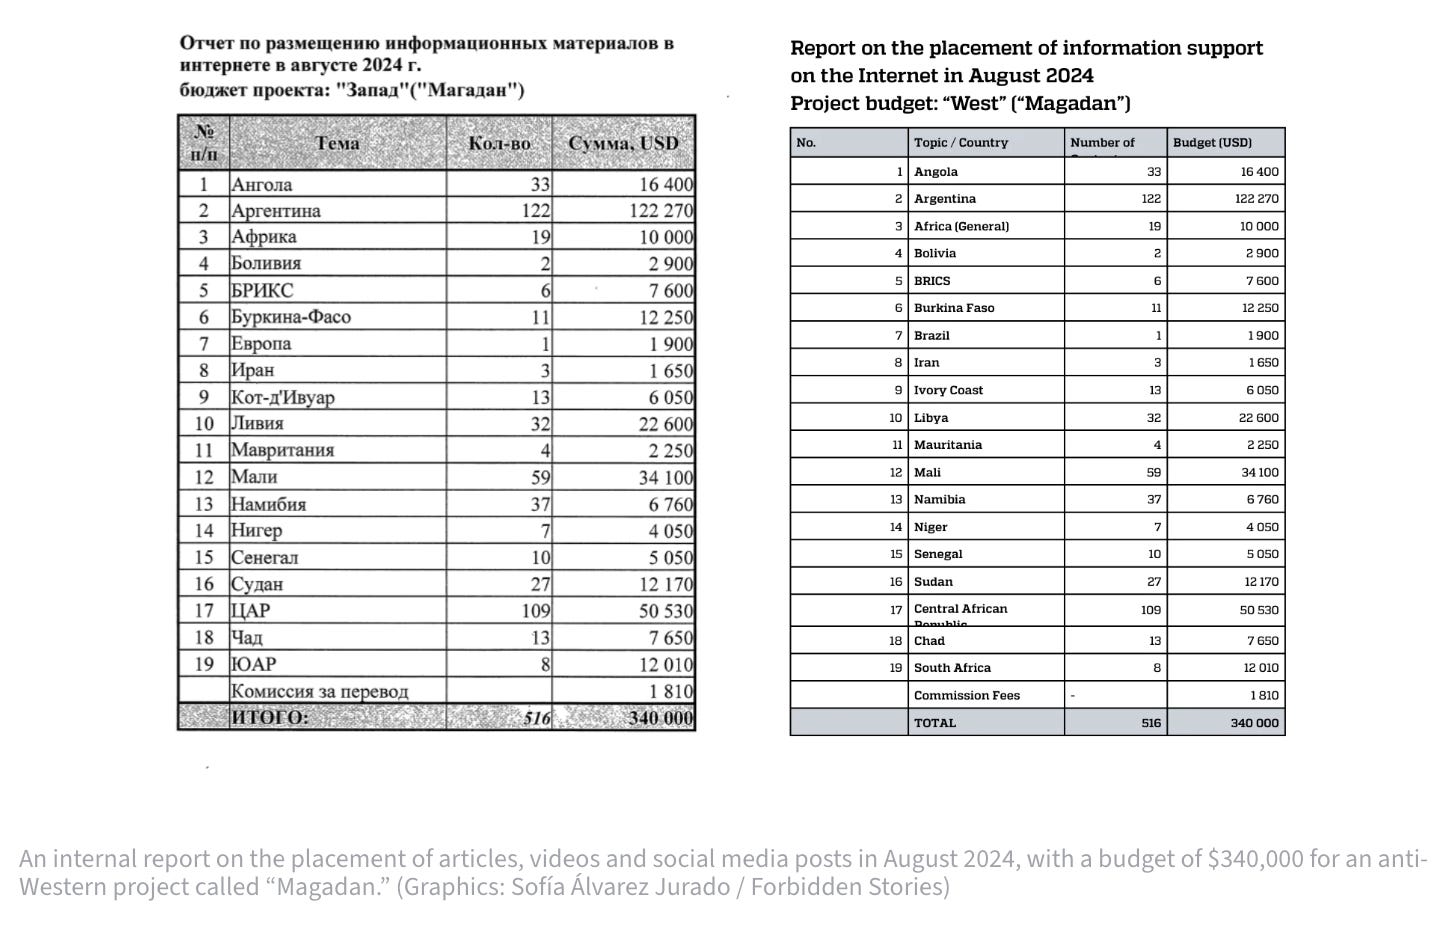
Forbidden Stories and partners published analysis of a 1,431-page leak that maps Russia’s foreign influence operations across Africa, Latin America, and the Middle East. The material covers ten months of activity in 2024, details a budget of about $7.3 million, and lays out payment structures, country targeting, and influence tactics in unusual detail.
What makes this useful is not just the scale. It is the level of operational texture: who gets paid, how narratives are seeded, how local intermediaries are used, and how methods tested in one country are adapted elsewhere. It is rare to get that kind of primary-source view into how influence operations are actually run.
I’ve covered more on this in the Case File further down.
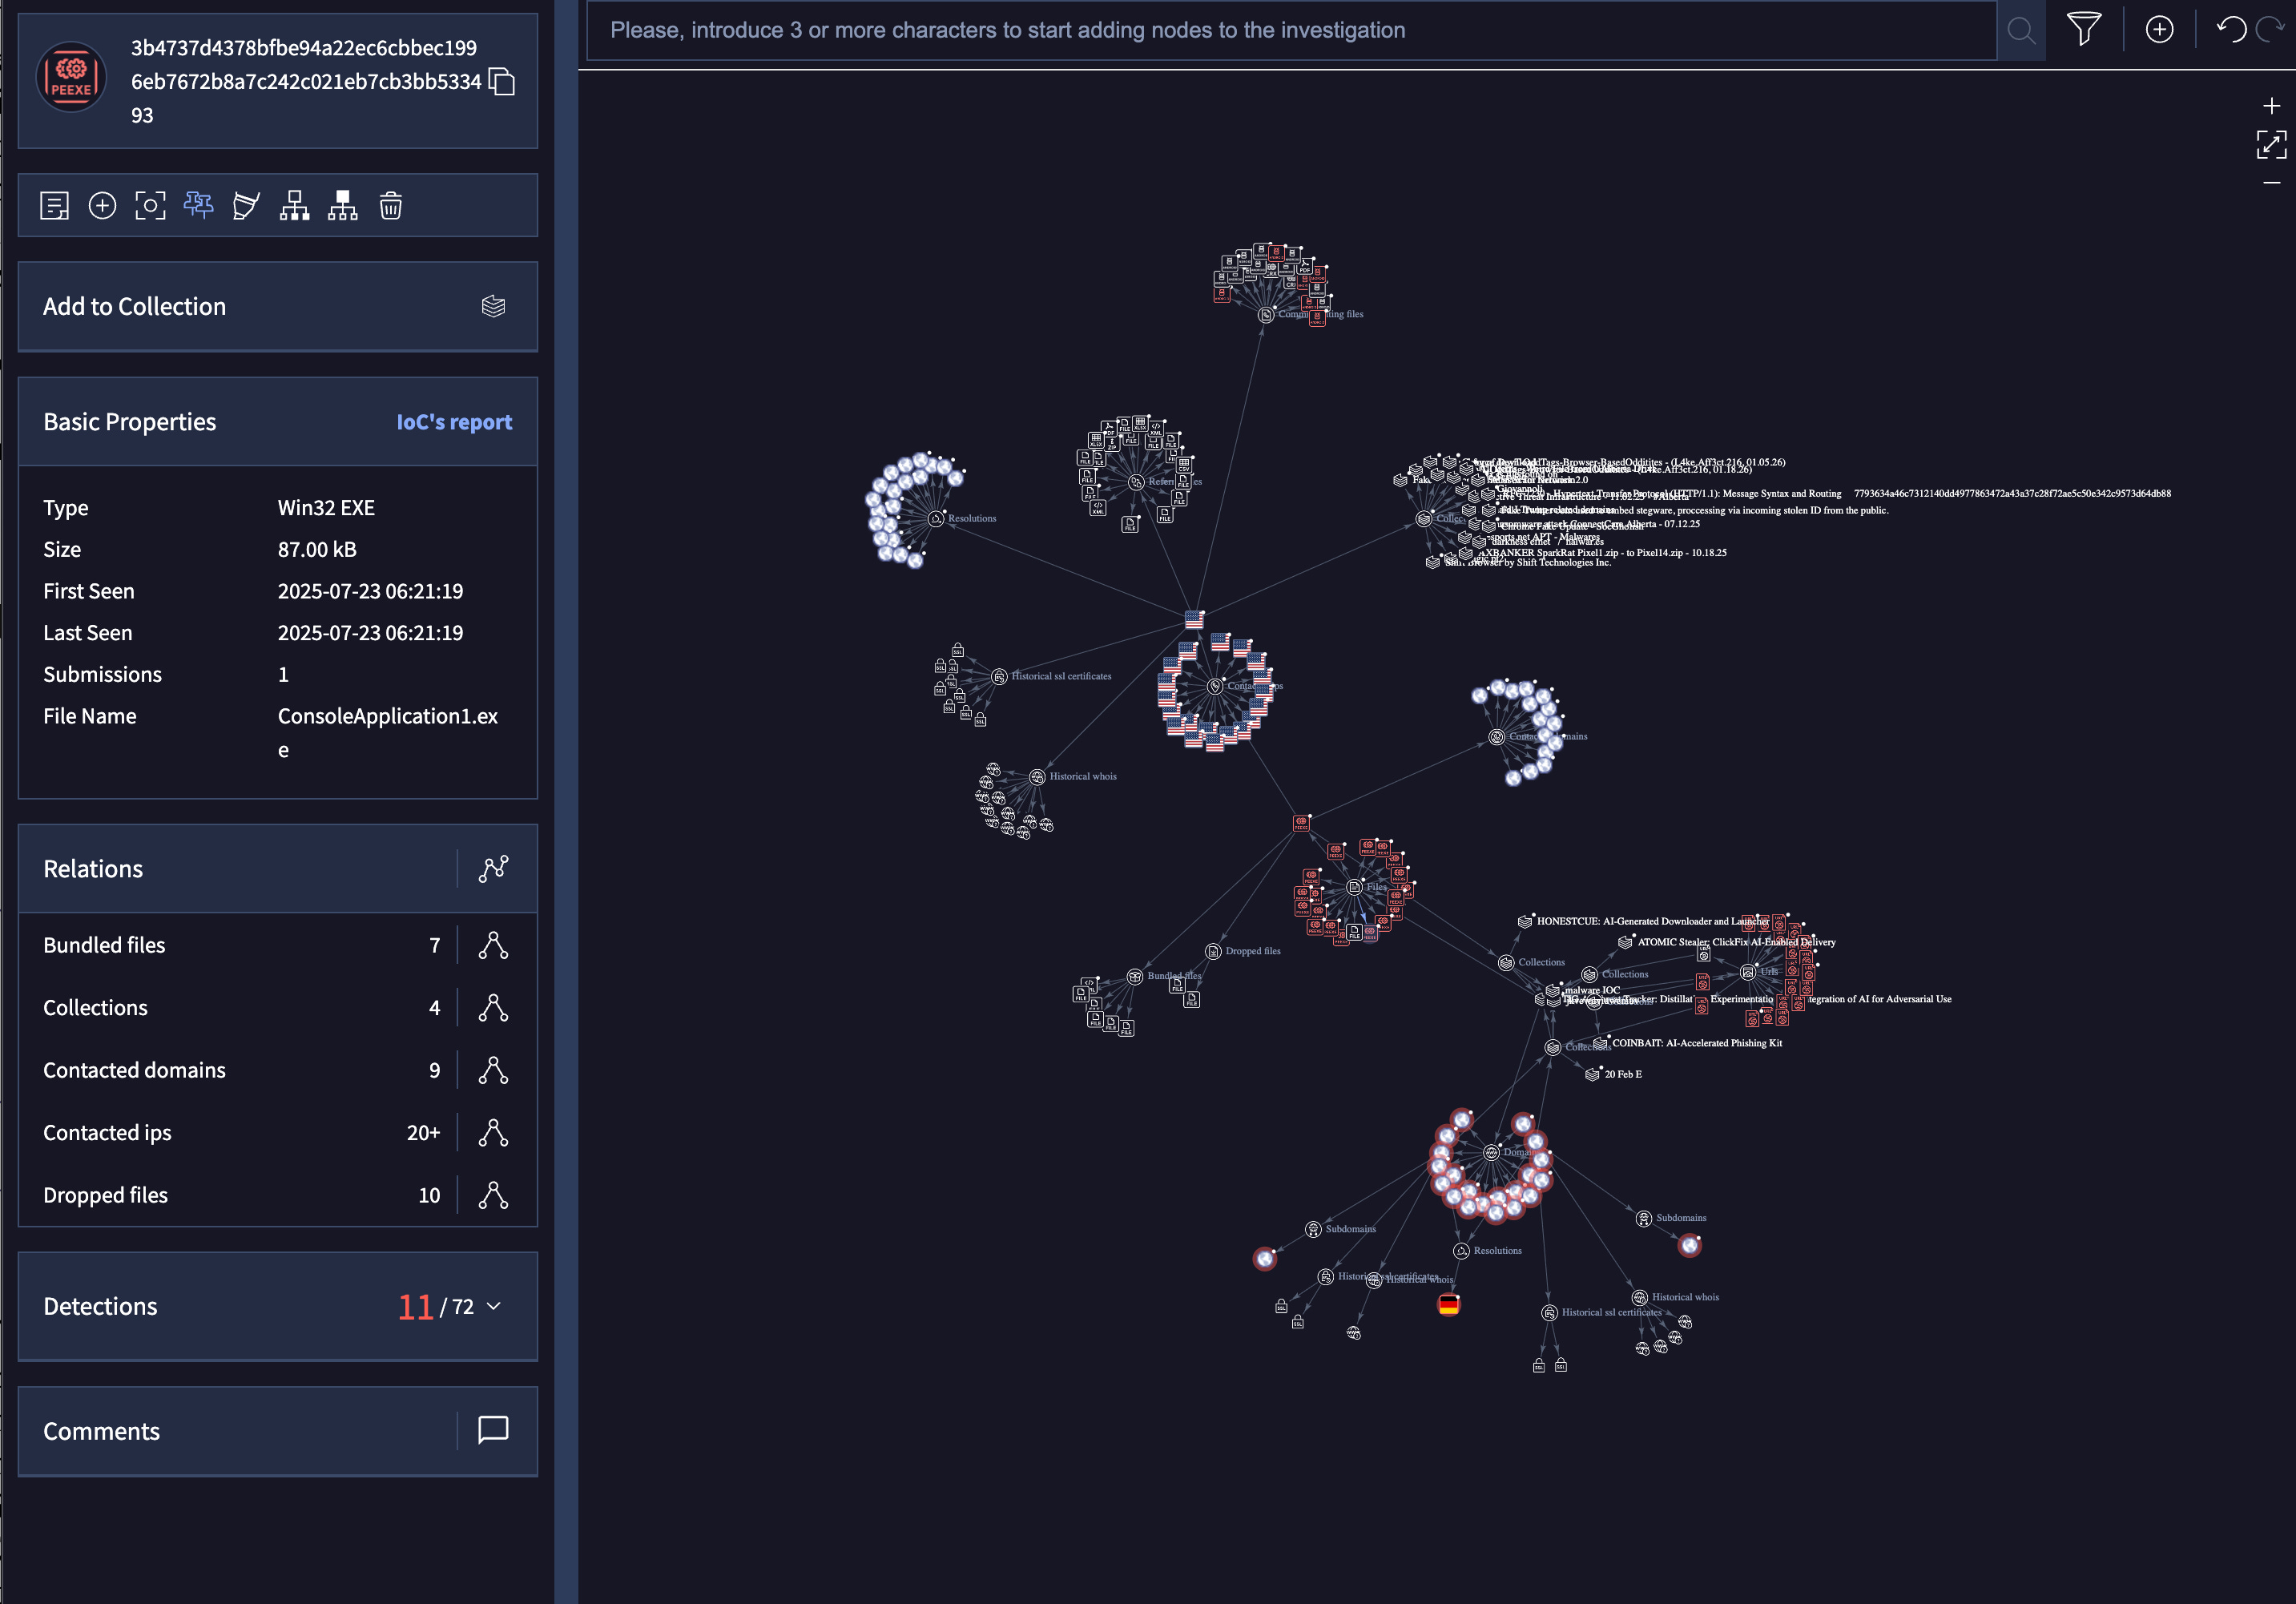
What State Actors Are Actually Doing With AI
Google Threat Intelligence Group’s latest AI threat tracker is useful because it trims away a lot of the hype. The report shows how state-backed and aligned actors using AI mostly as an efficiency layer: research, target profiling, email enumeration and phishing support. The near-term problem is usually not wholly new attack classes. It is that familiar workflows get faster, cheaper, and easier to scale. That is a more grounded way to think about risk than generic claims that AI changes everything overnight.
One thing that is also quite useful for researchers looking at GTIG’s reporting is that they often include Indicators of Compromise (IOCs). These can easily be interacted with through a graph user interface.
Estonia's Annual Assessment: The AI Testing Method Worth Keeping
The Estonian Foreign Intelligence Service’s 2026 annual report is publicly available. Chapter 4.1 documents a GRU procurement network through Neptun Ko Ltd, a Moscow import/export company that rebranded as an Egyptian firm post-2022 while its registration, address, and personnel stayed unchanged. The report names ten personnel as GRU officers, publishes a December 2022 invoice for over €500,000 in semiconductors through two Chinese suppliers, and documents the relabelling route used. While the case study on the company and supply chains was a helpful case study, of which there’s a few more leads, Chapter 6.3’s testing of platforms like DeepSeek for propaganda insertion was quite interesting and a replicable case study.


2. TOOLKIT
The Dark Light Viewer gets its own section below. A few other tools and techniques worth keeping on the radar this month are:
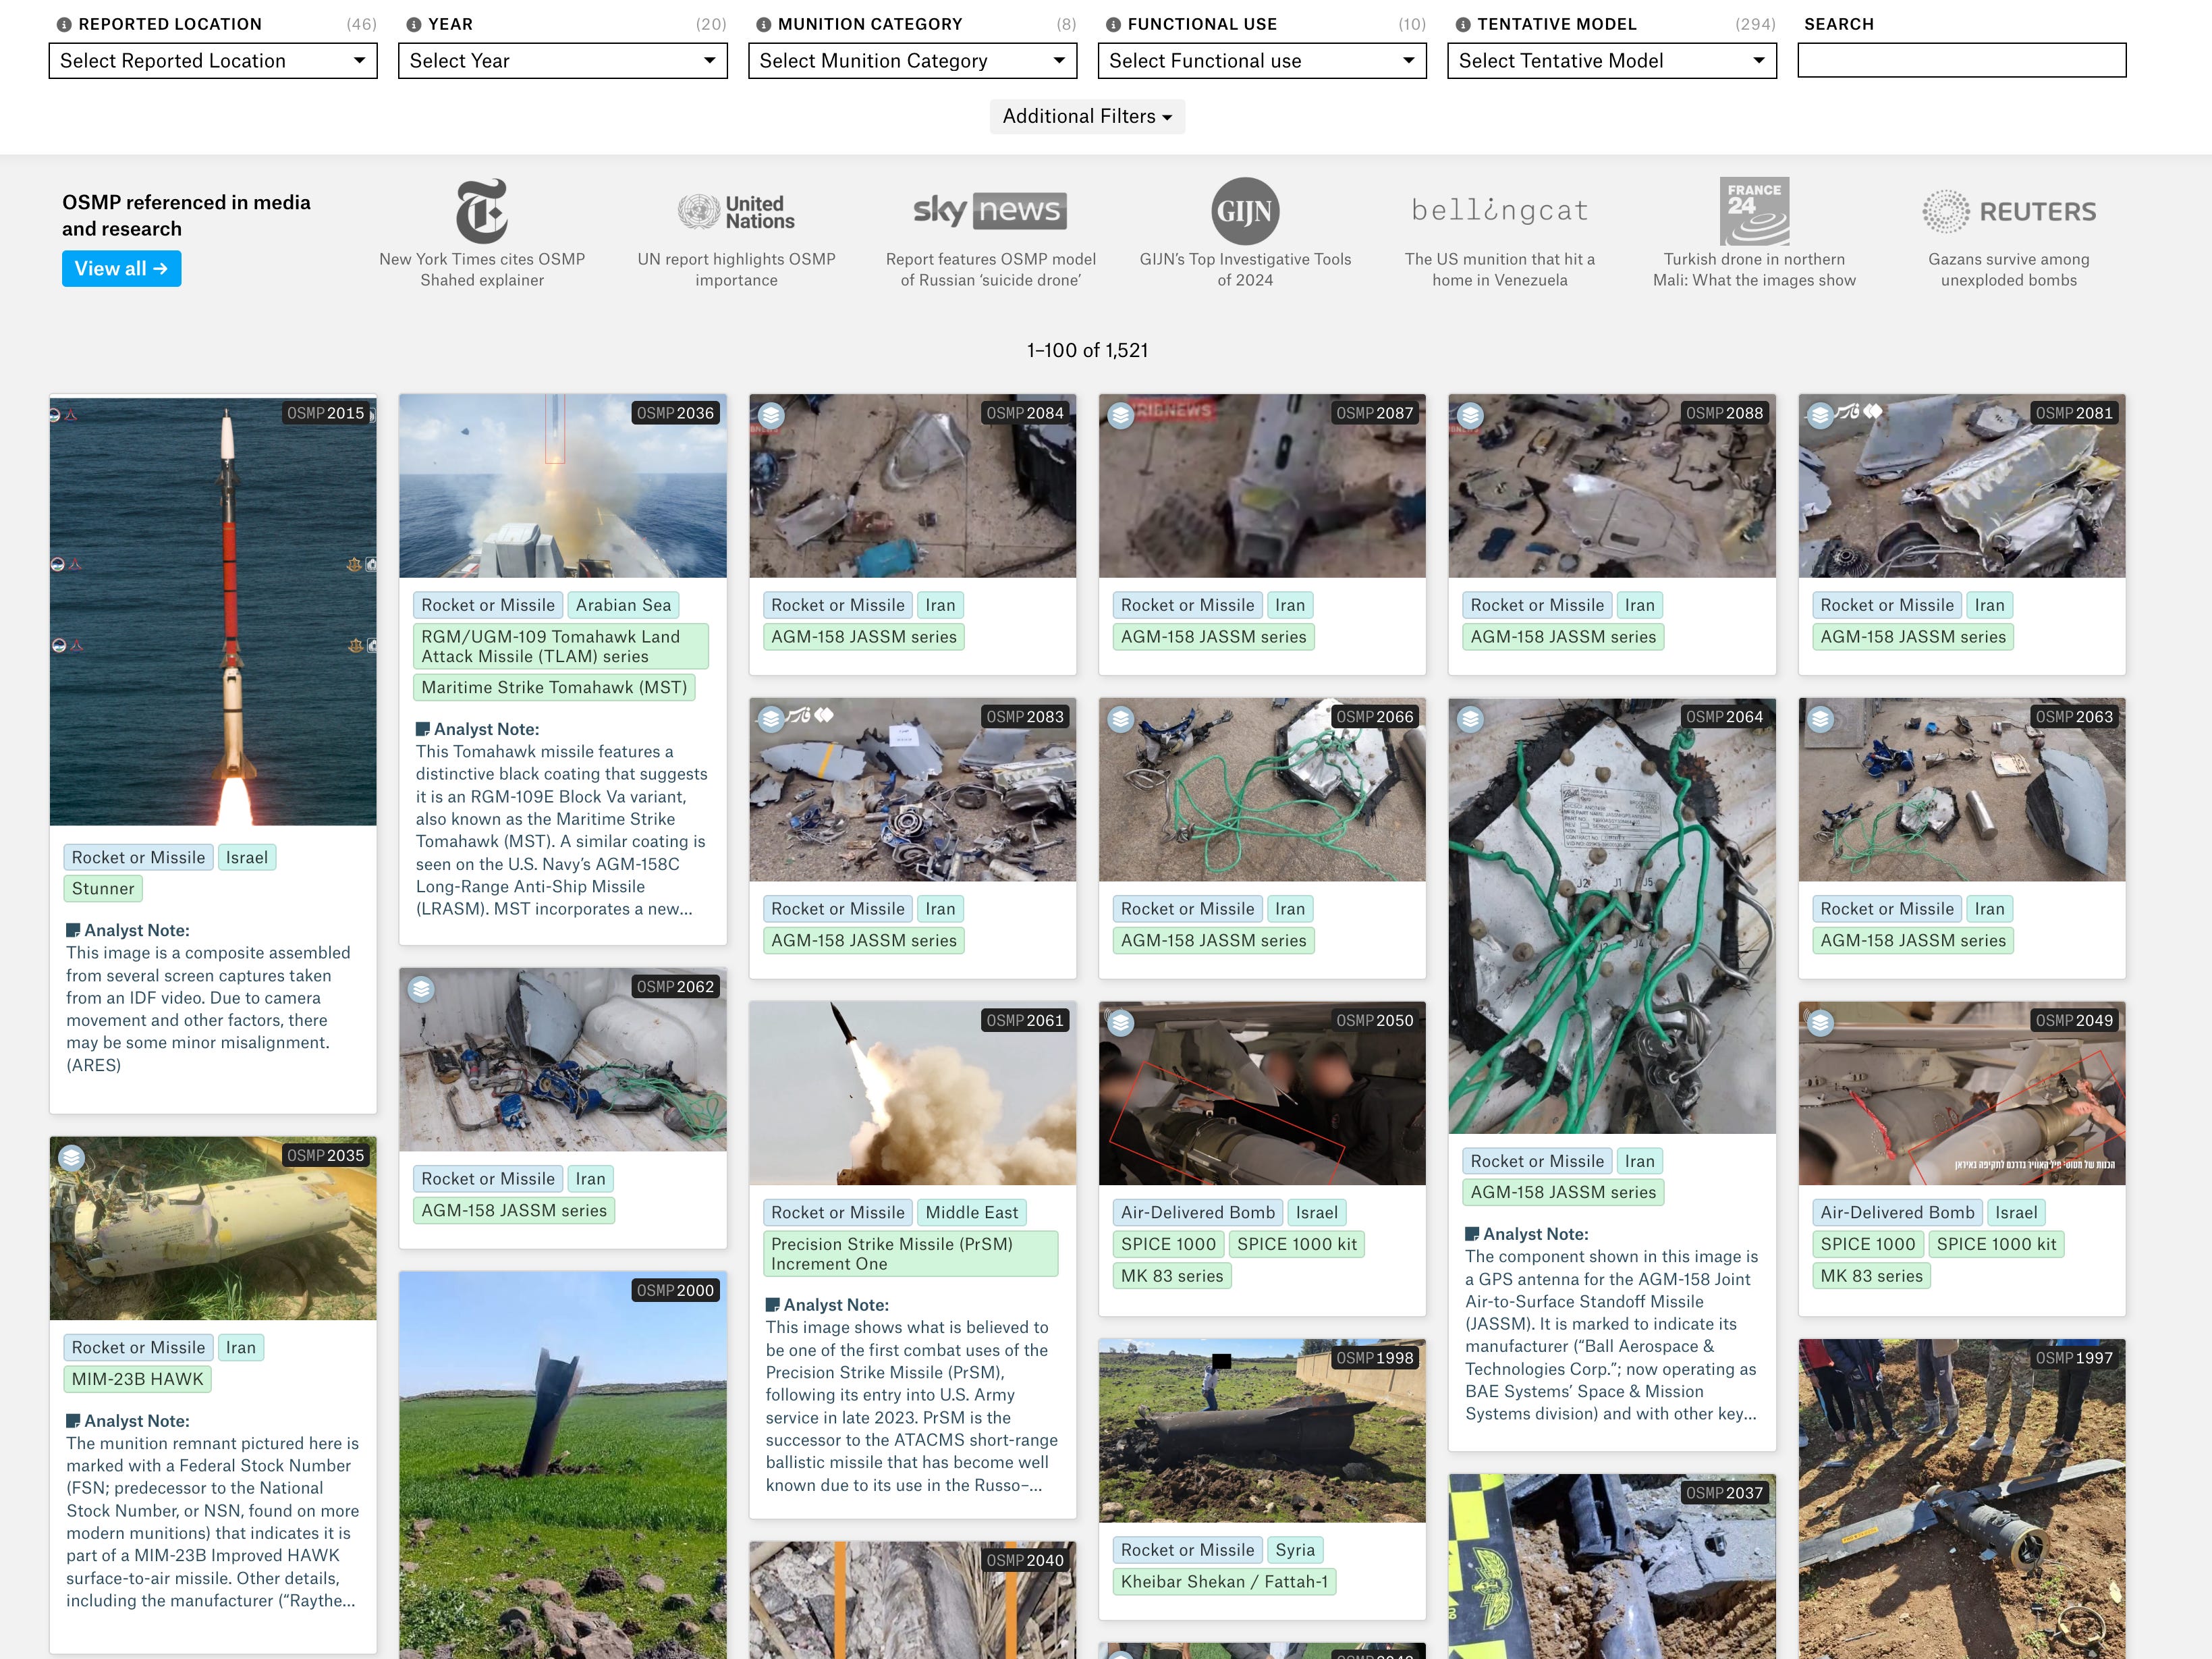
OSMP: Open Source Munitions Portal
OSMP has continued updating its Iran War 2026 collection and remains one of the cleanest public reference libraries for weapons identification from open material. It works best as a companion to reverse image search and debris analysis, not as a substitute for them.
Forensic OSINT Snowflake Timestamp Decoder
Forensic OSINT published a browser-based tool that decodes creation timestamps from X post IDs. Because the platform’s Snowflake format embeds time in the identifier, the timestamp can often be recovered even when the post is gone, as long as the URL or ID survives.
SpaceFromSpace: Declassified Satellite Archive
Harry Stranger’s map viewer for georeferenced CORONA and related reconnaissance imagery is so nice. It lets you pull historical baselines onto a modern globe without wrestling with the raw archive, which makes old coverage far easier to use for perimeter change, site history, and infrastructure growth work.


3. TECHNICAL TEARDOWN
See what changes, on earth, at night, in one image
The Dark Light Viewer is a free browser-based tool I built on Google Earth Engine that uses NASA’s VIIRS night-light data to show where human-generated light has increased or decreased over time.
The reason I built it is simple, when I am focussing on a particular geography, I like to take a zoomed out approach to understand what has happened around an event, and then find particular places to dig deeper on. This map has been incredibly helpful for me, as it highlights when change has happened and where. It basically does that in one single image illustrating a change detection using a global dataset that goes back to 2012.
The core use case is conflict and crisis documentation, but it is just as useful for displacement, recovery, industrial activity, and long-term urban change. Night-light analysis has already been used to track collapse in Gaza, changes across Ukrainian regions after the full-scale invasion, and shifts around conflict-affected border areas elsewhere.


So how can you go about using it for your own monitoring?
1. Start with the one-year view. If you are looking at slower trends such as reconstruction or long-run decline, move out to five or ten years after you understand the recent picture.
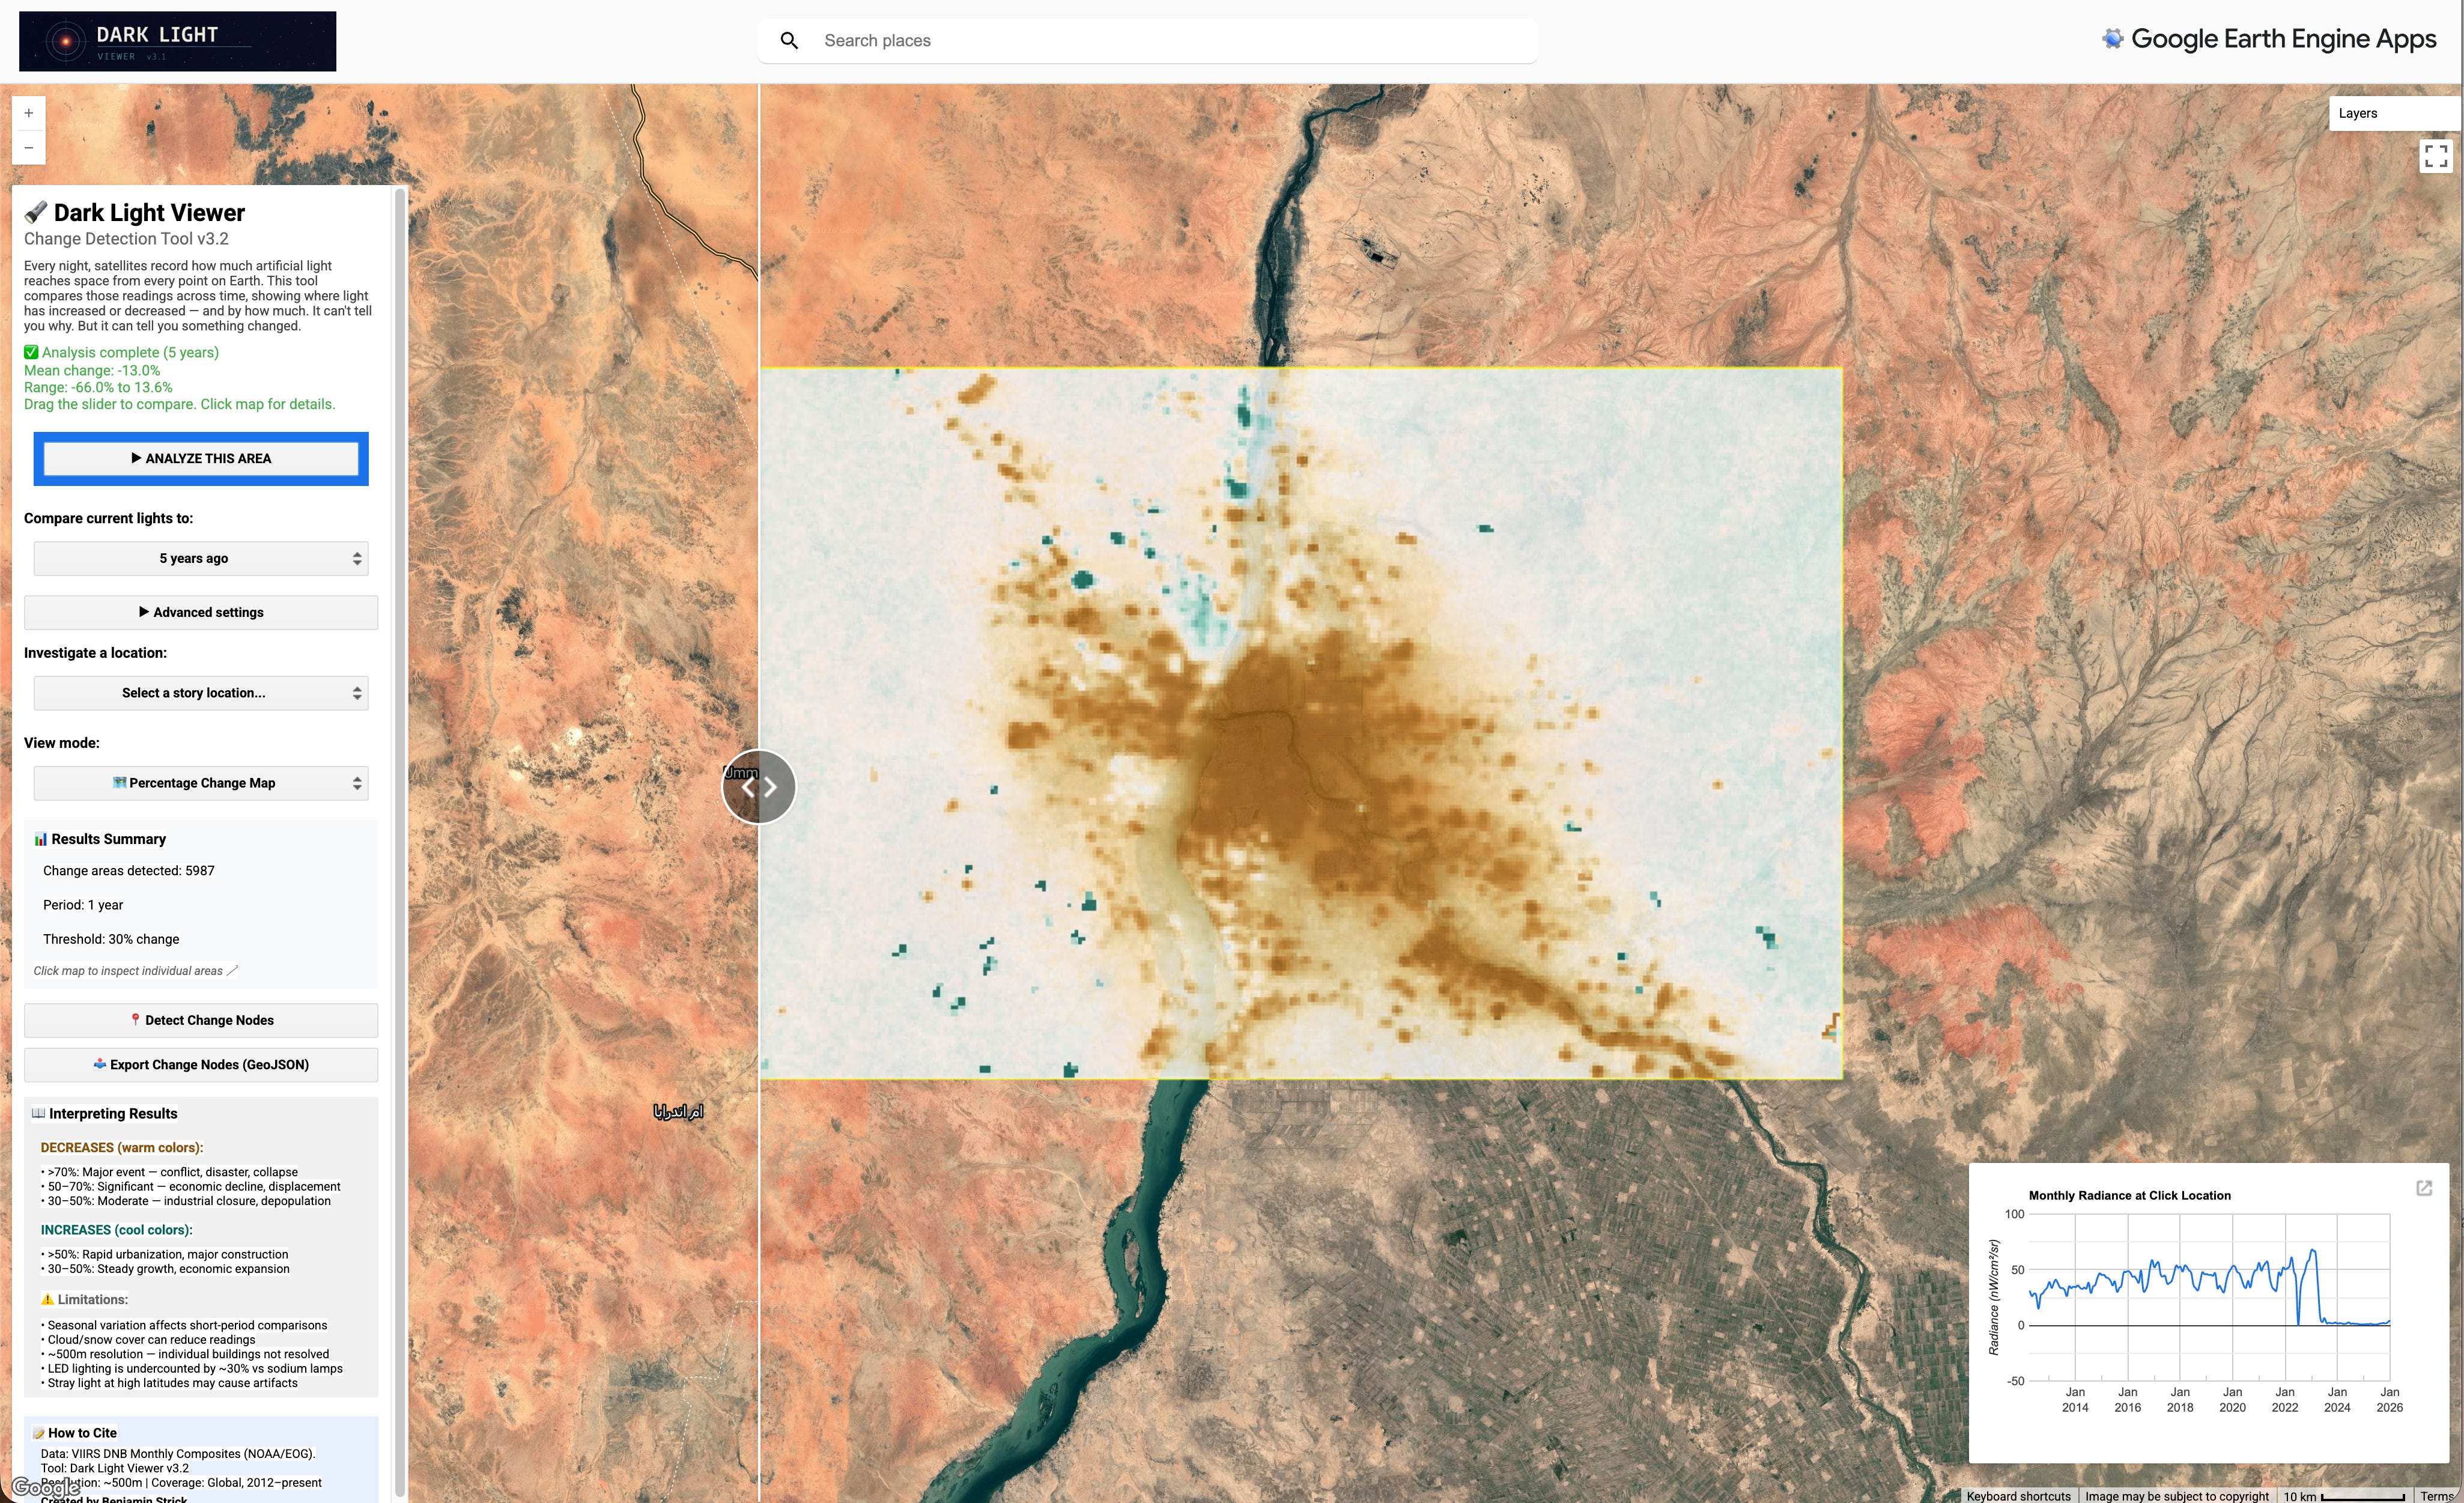
2. Read the overlay before you click anything. Warm colours show radiance (lights at night) loss. Cool colours show growth. A broad reddish cluster across a district usually suggests structural change, not a one-night outage.
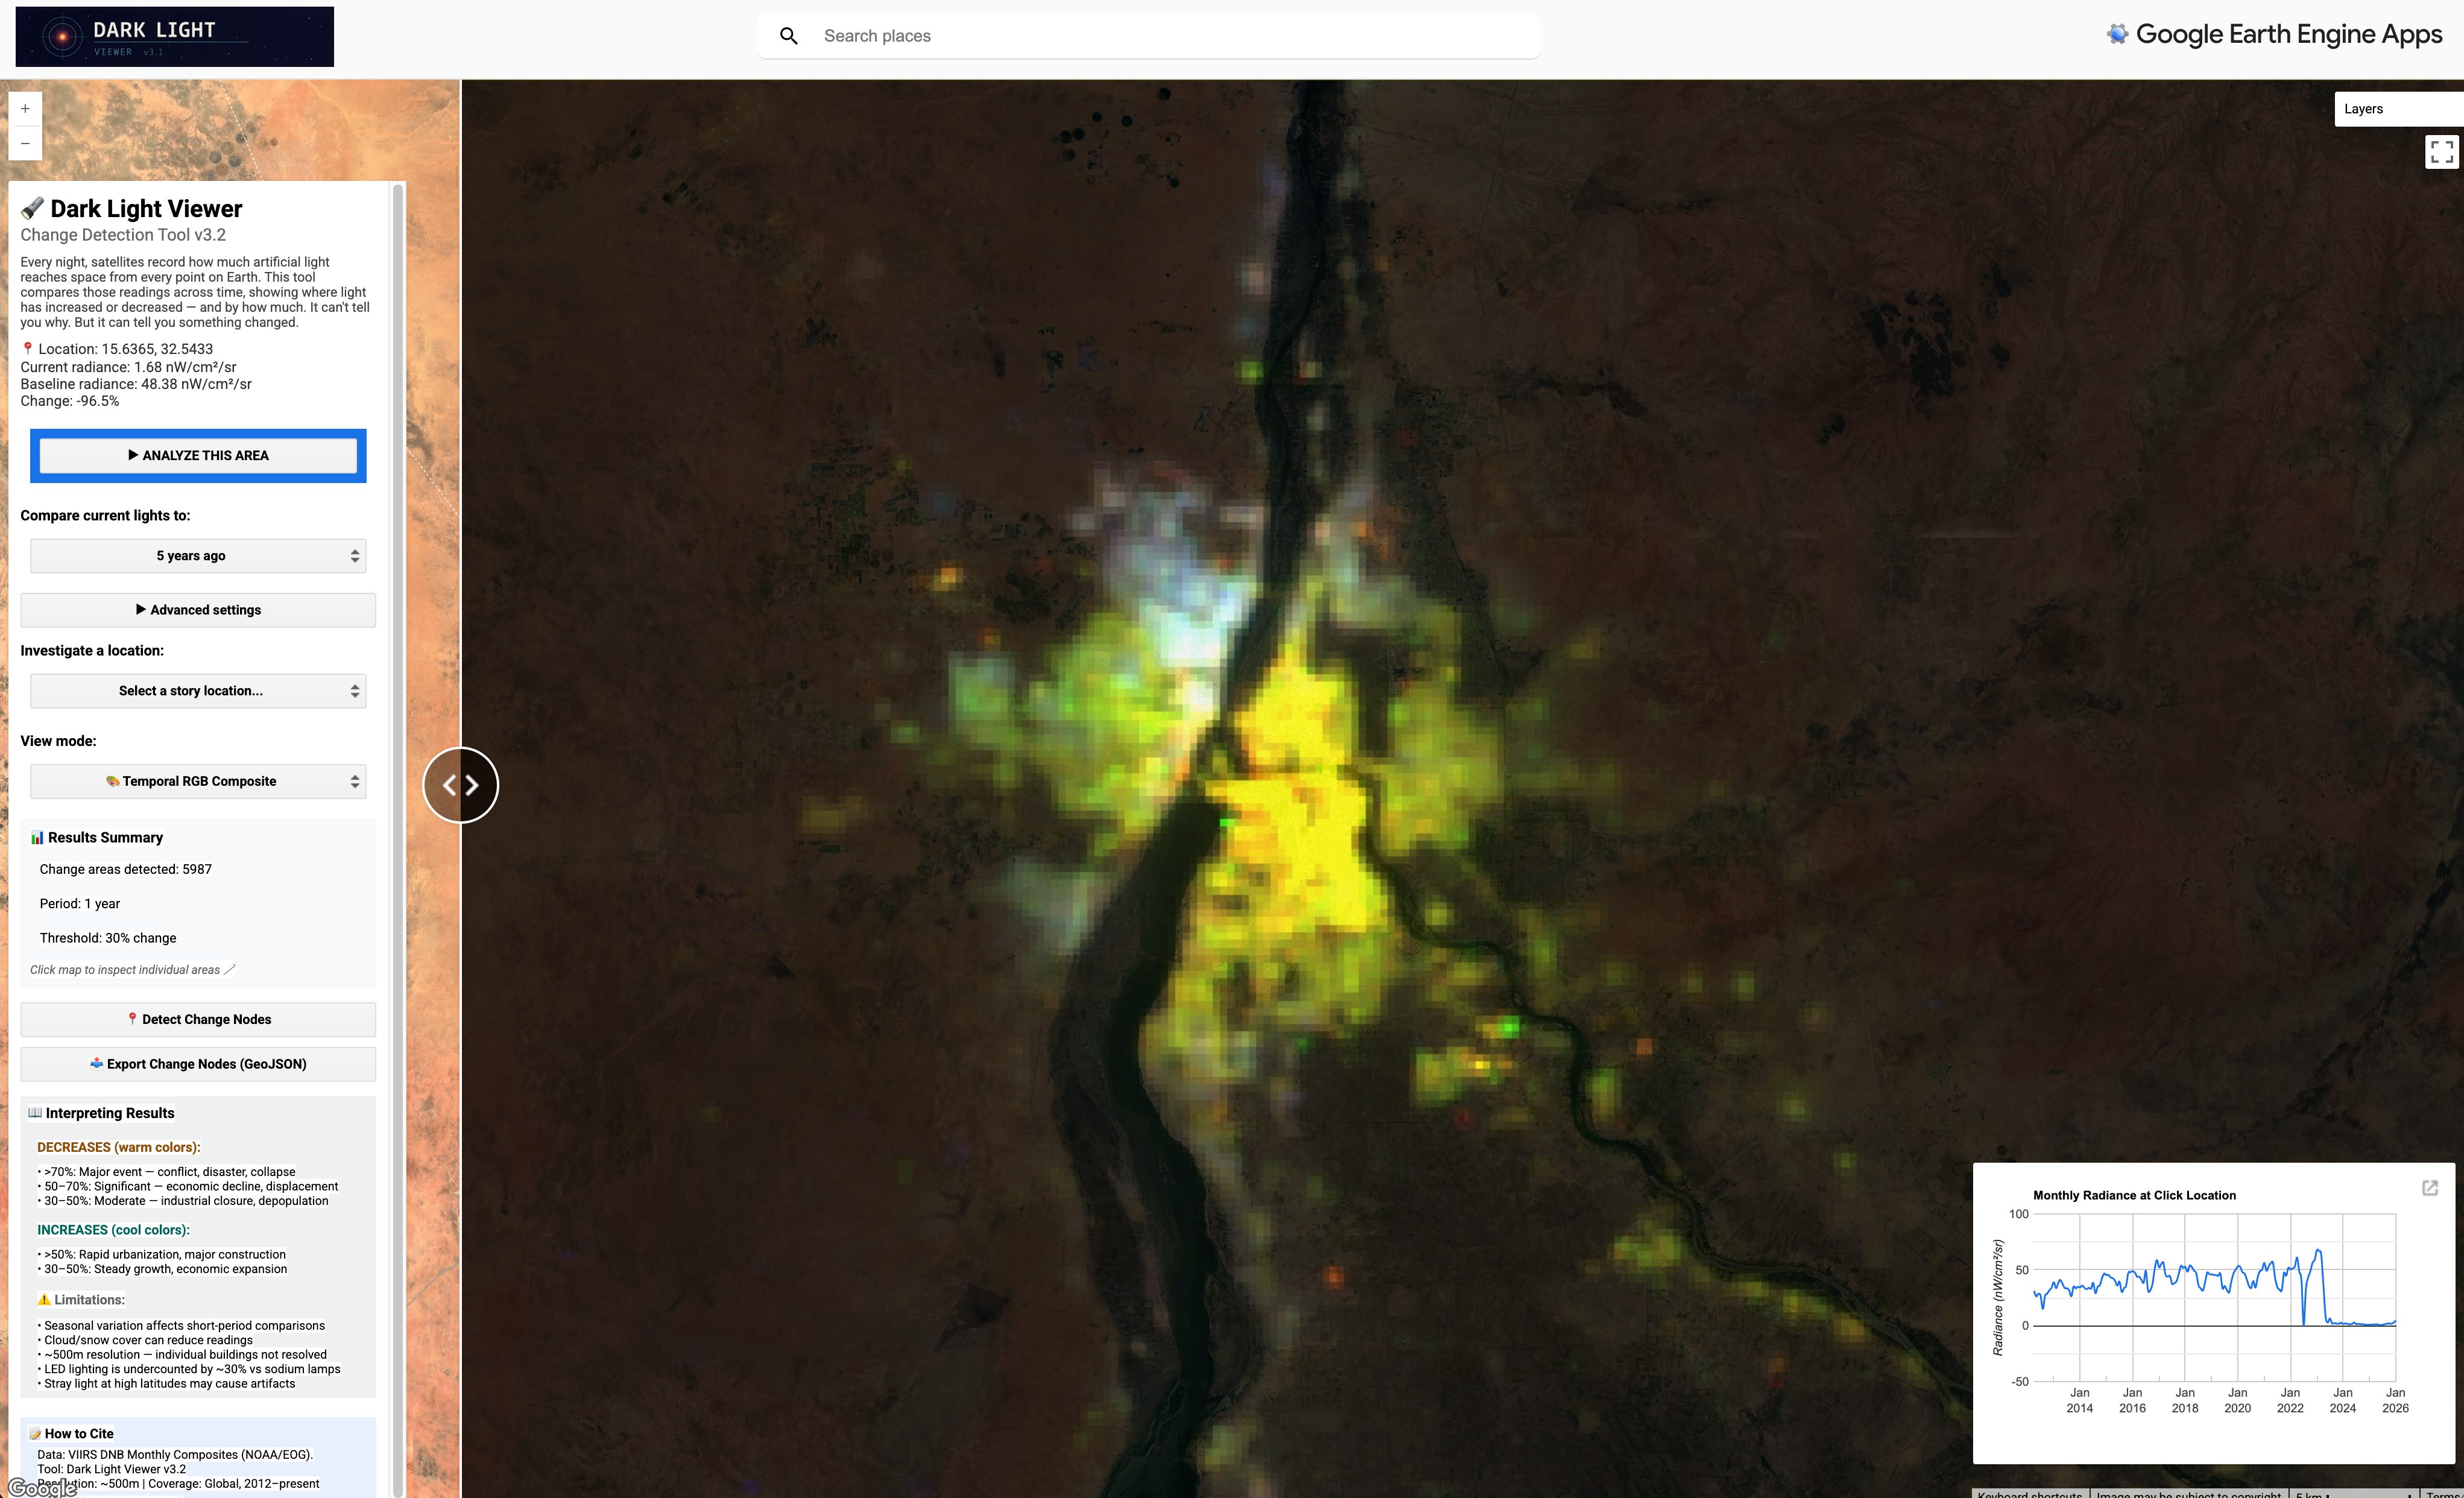
3. Then click for the time series. This is the important part. The chart shows you when the change began, whether it was sudden or gradual, and whether the area recovered. That is what lets you separate a short disruption from a real shift in activity.
4. Export the GeoJSON when you’ve found something you want to dig further into. The export includes percentage change, pixel counts, area, severity class, and cluster IDs, which makes it easy to move into QGIS, Google Earth Pro, or another GIS workflow.


5. Cross-reference with satellite imagery and on-ground verification (news reports, footage etc). VIIRS undercounts some LED lighting, fires and gas flares can look like growth, and cloud cover can create gaps in monthly composites. Polar regions above roughly 65 degrees latitude are excluded.
The tool’s 750 metre resolution is enough for district and city-scale analysis, but not for single-building claims. For that, you still need higher-resolution imagery. What Dark Light Viewer gives you is broad coverage, a long time series, and a method that you can reproduce yourself.
If you want to see more on the Dark Light Viewer, I’ve published the code on Github, and have a number of case studies on my website here.
4. CASE FILE: PROPAGANDA MACHINE
Russia’s SVR spent $7.3 million placing articles, funding radio stations, and engineering political instability across thirty countries between January and October 2024.
A seven-outlet consortium including Forbidden Stories, All Eyes on Wagner, OpenDemocracy and the Dossier Center verified 1,431 pages of internal documents from the network, referred to as “the Company”. It had 98 employees by May 2024 and absorbed Prigozhin’s operation through an SVR handover in December 2023.
This type of work shows the power of collaboration. One organisation could have gone through those documents, but through collaborative efforts, each organisation can emerge with different findings relevant to their expertise and skillsets. At the end of the day, it’s knowledge and findings multiplied.
What was found
Article placement rates ran from $50 to $10,000 per piece.
Chad received 171 sponsored articles over one year for USD$96,750, mixing pro-Russia coverage with aim to remove the country “from the sphere of influence of France and the United States” by “limiting the ability of French forces to use their military base to violate the airspace”.
Niger’s objective was narrower: block all meaningful dialogue between the junta and Western capitals.
In Madagascar, the plan was to trigger Western sanctions against President Rajoelina by publicly linking him to Russia. It failed.
Turkey receives treatment across 20 documents, with operations through United World International in Istanbul aimed at keeping Ankara’s Libya position costly and contested.
The CAR is described as the operation’s laboratory, with nearly $100,000 budgeted in May 2024 partly to fund Lengo Sengo, a local radio station used as a distribution outlet.
Practicals
Start with structure, not content. Before reading for quotes, extract names, payment figures, and country targets. The named individuals are your open-source threads:
Individuals with academic roles or SVR roles mentioned in Dossier Center report and event attendance at SPbSEU are publicly checkable
Registration records are open-source anchors and can be referenced with many of the linked companies in the reports
Following the leads established through the All Eyes on Wagner social media investigations may open up new avenues.
A relevant point to mention when working on document triage at this scale is that Pinpoint handles mass entity extraction well. But it is a cloud product, so weigh the sensitivities before uploading.

CLOSING NOTE
What connected most of the material this month was how much of it depended on records that existed before anyone knew they would matter. The satellite images of Minab’s school perimeter were captured years before the strike. The CEO’s identity was assembled from stock footage and public company filings that had always been accessible, just not in conjunction. The Propaganda Machine documents were created for internal use by people who presumably did not expect them to land with a consortium of seven newsrooms. In each case the record survived, and the record was what made the claim checkable.
That is not an argument for optimism, plenty of records get destroyed, posts get taken down, plenty of investigations stall. But it is a practical point: building and maintaining the habit of systematic documentation, archiving, and source attribution makes the work more durable when it matters.
If it was useful, forward it to a colleague. That is still how most people find it.
Ben.
The amusing thing is that a budget of about $7.3 million is literally invisible compared to the US expenditures to influence, and in fact destabilize, countries around the world to a degree Russia could only imagine.
Otherwise, a great report with links to numerous valuable OSINT tools. Keep it up.
I am absolutely loving this series because right now I am navigating between my life in the realm of AI policy and my love for where I started - that is open source investigations. Your blogs are a way for me to stay in touch with my life that was. And I hope that I can create an amalgamation of some sorts while channelling my love for both fields .